← Back to Mohammed Ashraf Hassan's portfolio
Sales & profitability
Super Store Sales Analysis
A project by Mohammed Ashraf Hassan — Data & BI Analyst
Sales & profitability
2.90M
Total sales
360.13K
Total profit
47K
Quantity sold
12.42K
Total purchases
The question
Across four years of orders, which segments, categories, and states actually carry profit — and is the trend improving or just noisier?
What I built
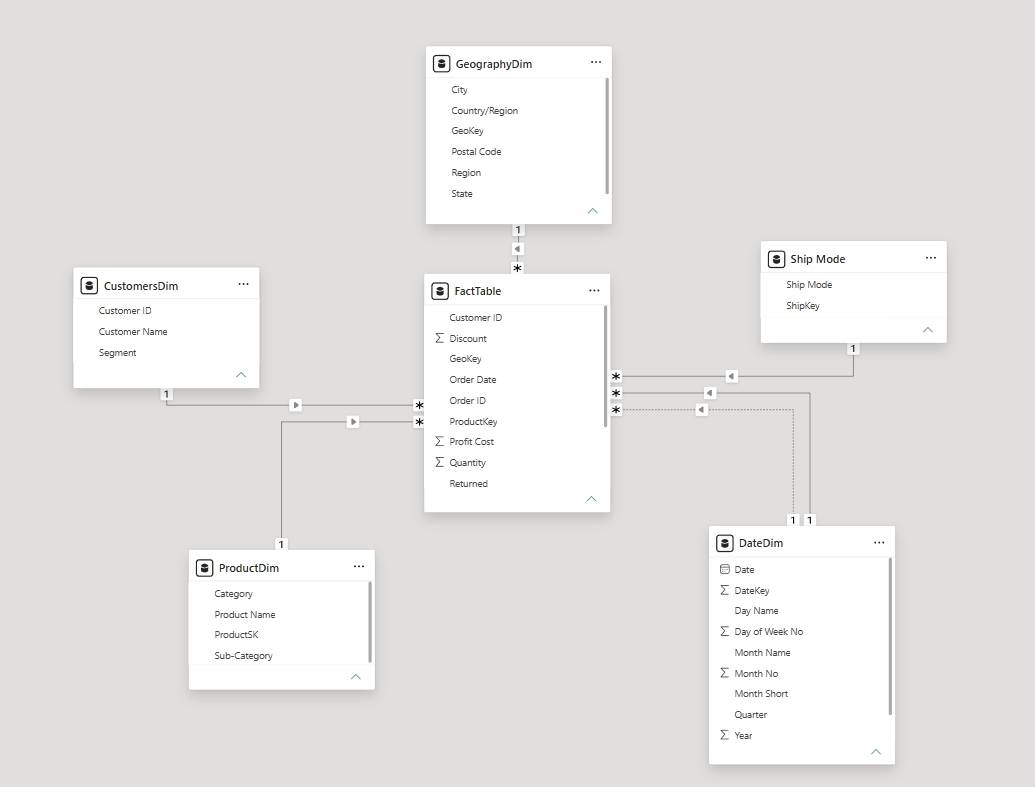
A single-page executive sales dashboard over a star-schema model with customer, product, geography, date, and ship-mode dimensions, filterable by year, region, and shipping method.
What it revealed
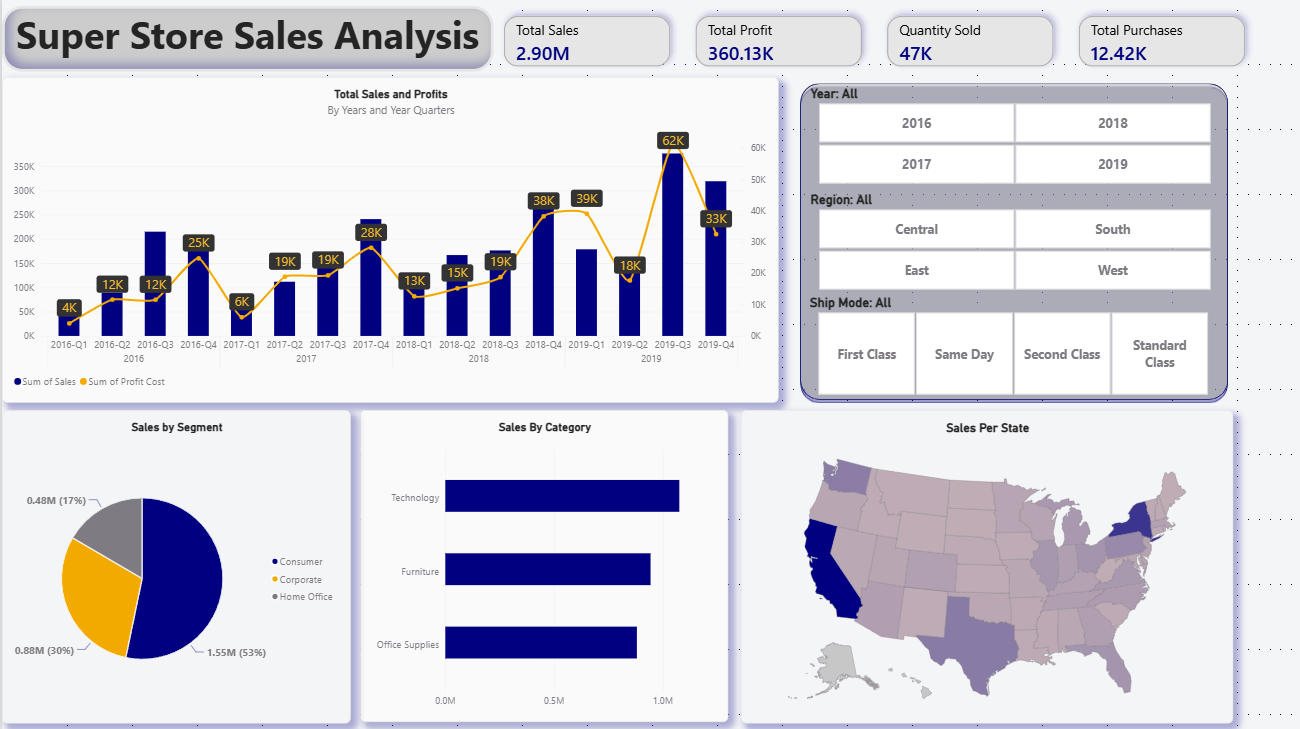
2.90M in sales produced 360.13K in profit, with quarterly profit growing from 4K to a 62K peak in Q3 2019.
The Consumer segment drives 53% of sales (1.55M), while Home Office contributes only 17% — a clear targeting signal.
Technology leads category sales, with Office Supplies close behind on volume but thinner returns.
Sales concentrate heavily in California and New York, exposing a geographic dependency worth diversifying.
Power BI
Power Query
Excel
Star Schema
Document
Report pages
Data model