← Back to Mohammed Ashraf Hassan's portfolio
Pricing & route analytics
Flight Tracking DB
A project by Mohammed Ashraf Hassan — Data & BI Analyst
Pricing & route analytics
300.2K
Flights analysed
20.89K
Avg ticket price
12.22
Avg duration (hrs)
6bn
Total ticket value
The question
With 300K flight records, which airlines, cabin classes, and booking windows actually drive ticket price — and where does price stop being about distance?
What I built
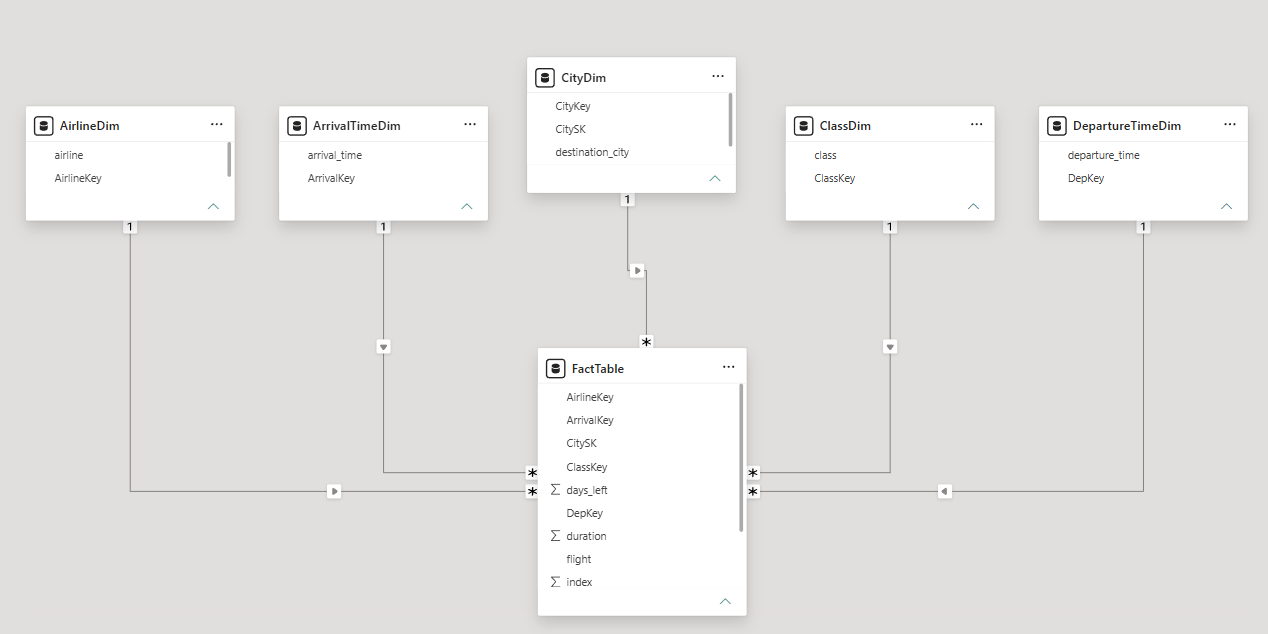
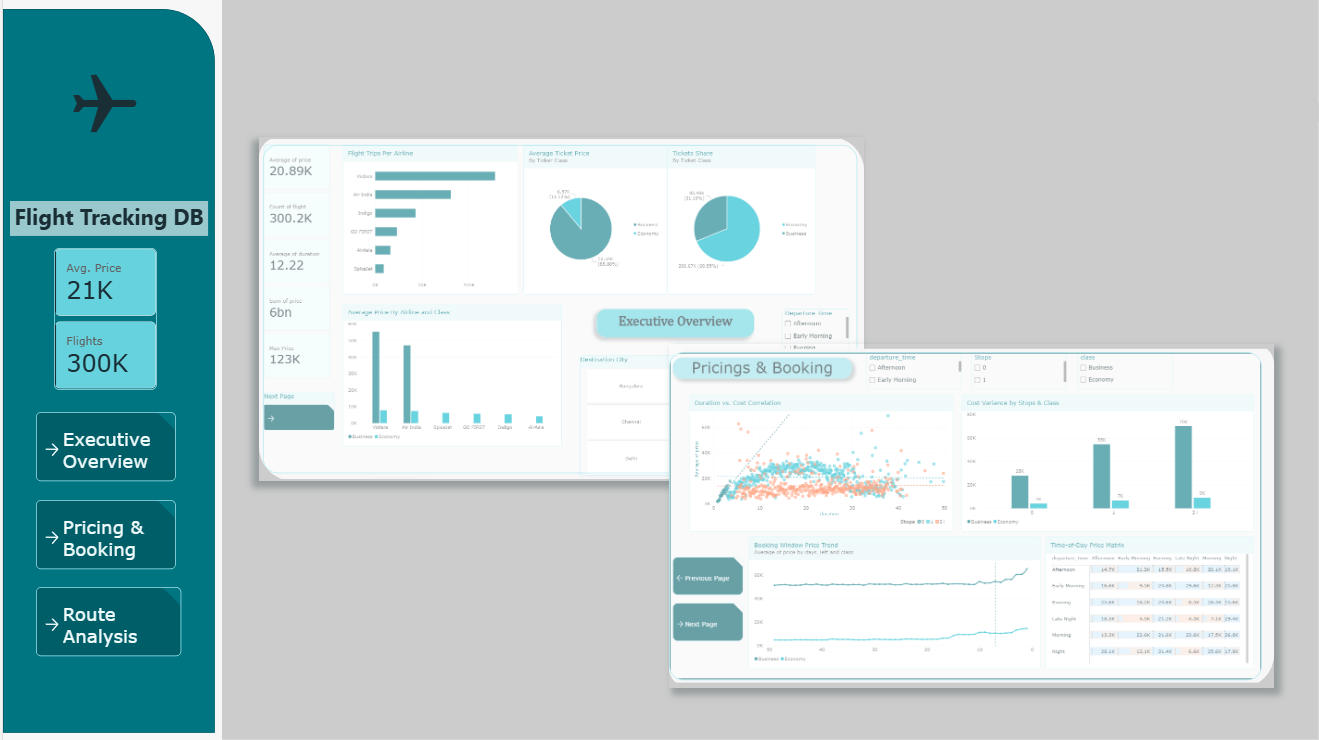
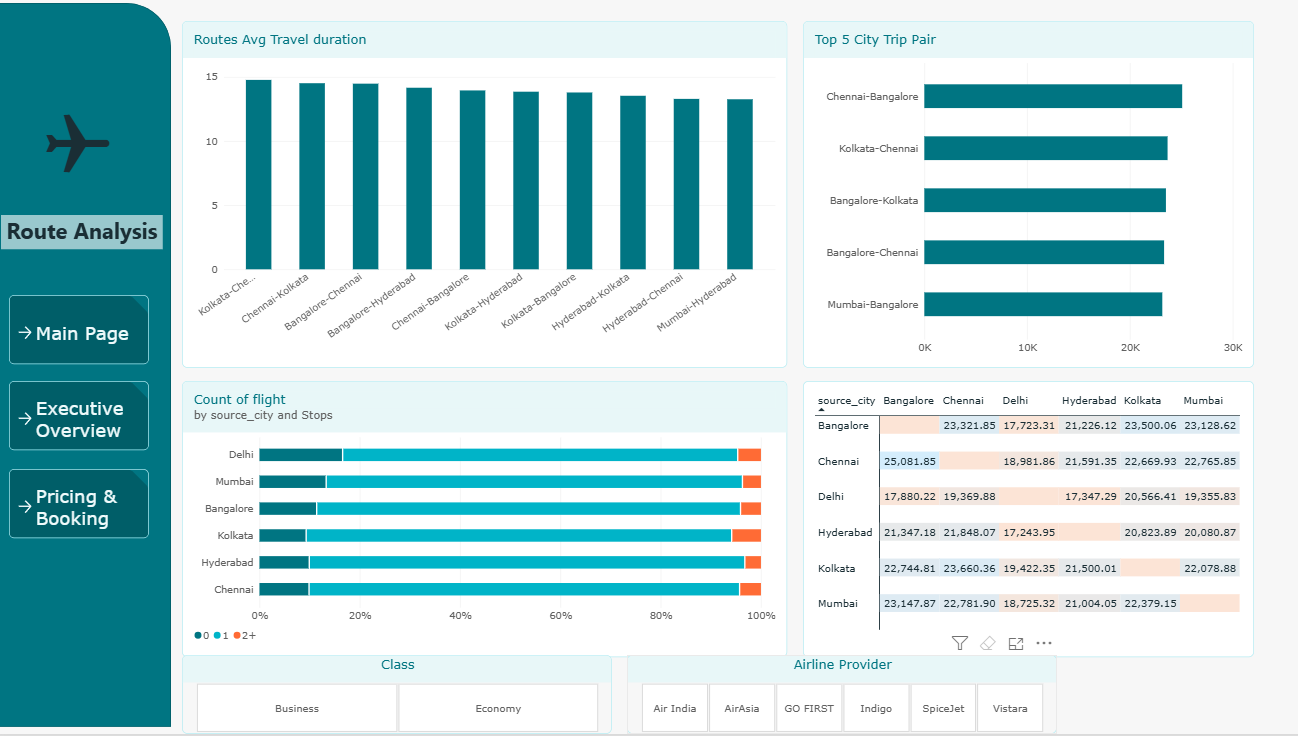
A three-page Power BI report on a star-schema model with airline, city, class, departure-time, and arrival-time dimensions. Pages cover an executive summary, a pricing and booking deep dive with correlation analysis, and a route-level view.
What it revealed
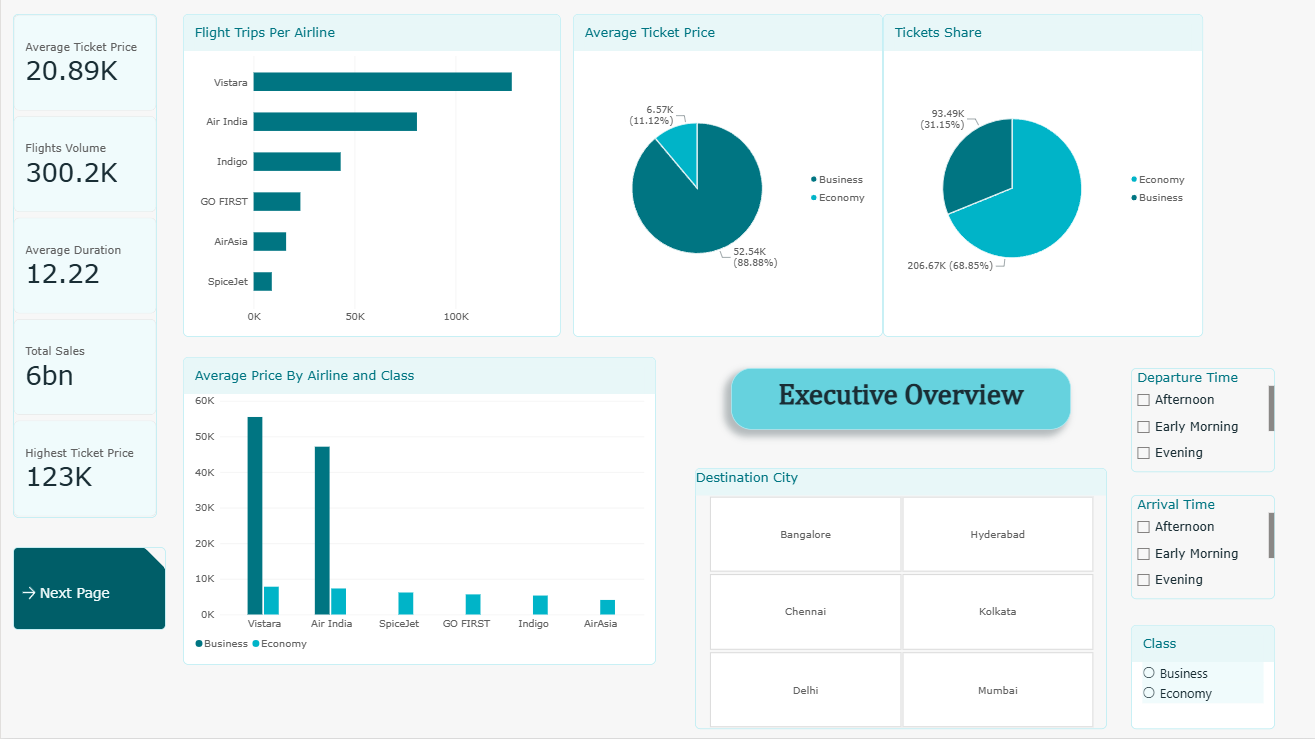
Business class is 11.12% of tickets sold but a far higher share of value, with average business fares several times economy.
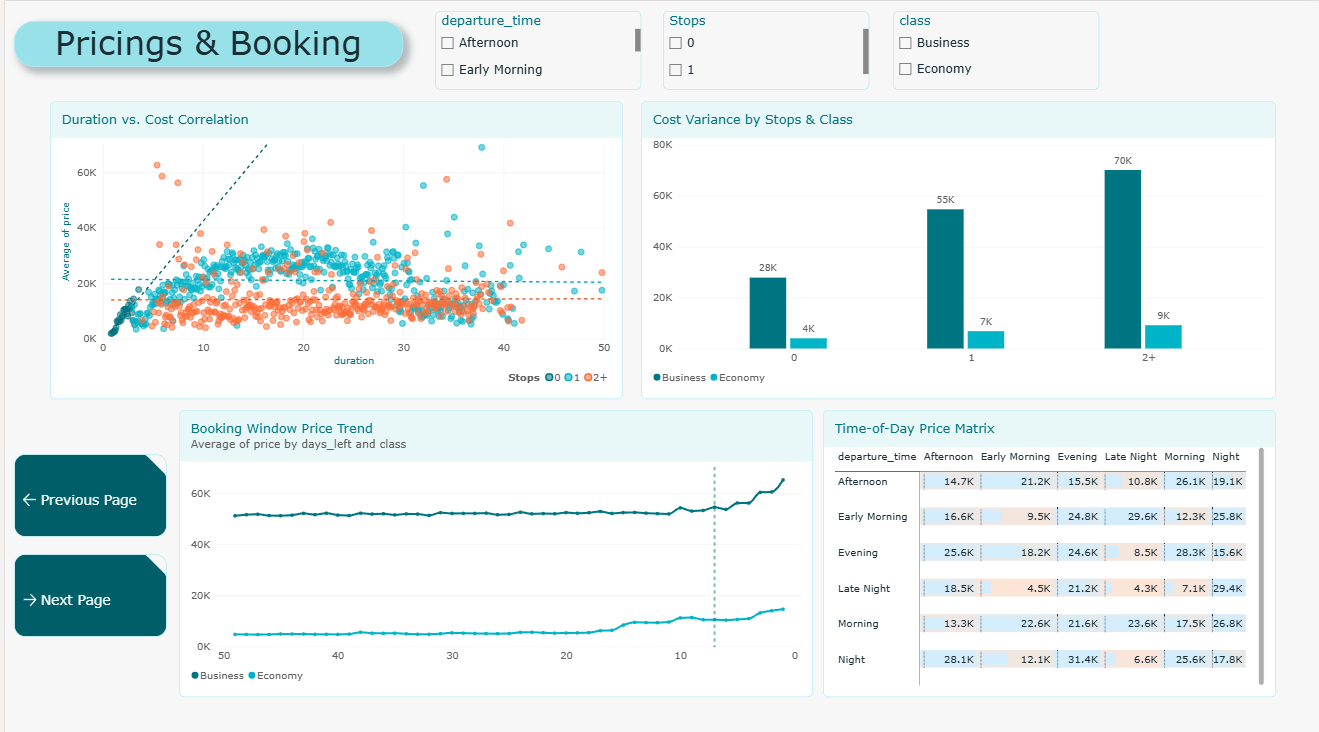
Duration barely predicts price: the correlation plot flattens after the first few hours, so scheduling — not distance — sets the fare.
Fares stay flat until roughly 10 days before departure, then spike sharply — a clear last-minute pricing window.
Vistara and Air India dominate both flight volume and premium pricing; the six busiest city pairs cluster around Chennai, Bangalore, and Kolkata.
Power BI
Power Query
DAX
Star Schema
Report pages
Data model