← Back to Mohammed Ashraf Hassan's portfolio
Lead project · DEPI capstone
Retail Performance & Operations Dashboard
A project by Mohammed Ashraf Hassan — Data & BI Analyst
Lead project · DEPI capstone
4.34M
Total sales
29.62%
Net profit margin
14.80%
Cancellation rate
625.61K
Lost to cancellations
The question
A retail business could see its revenue but not what was quietly draining it — cancelled orders, slow shipping, and discount-heavy sales reps.
What I built
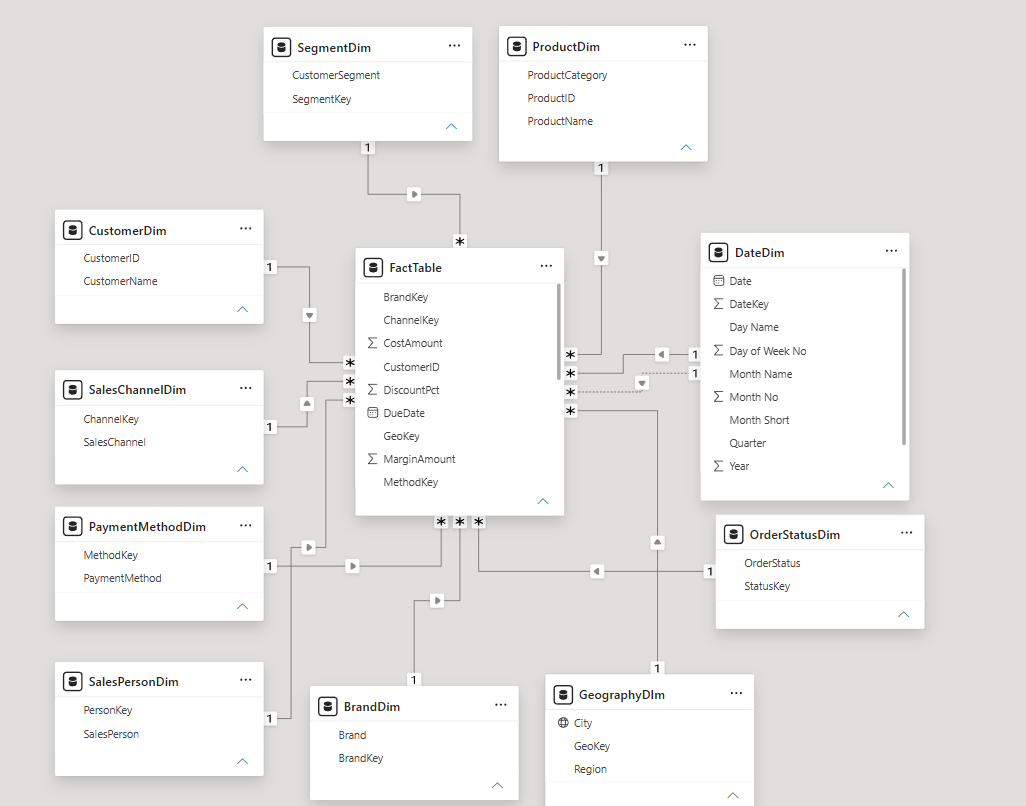
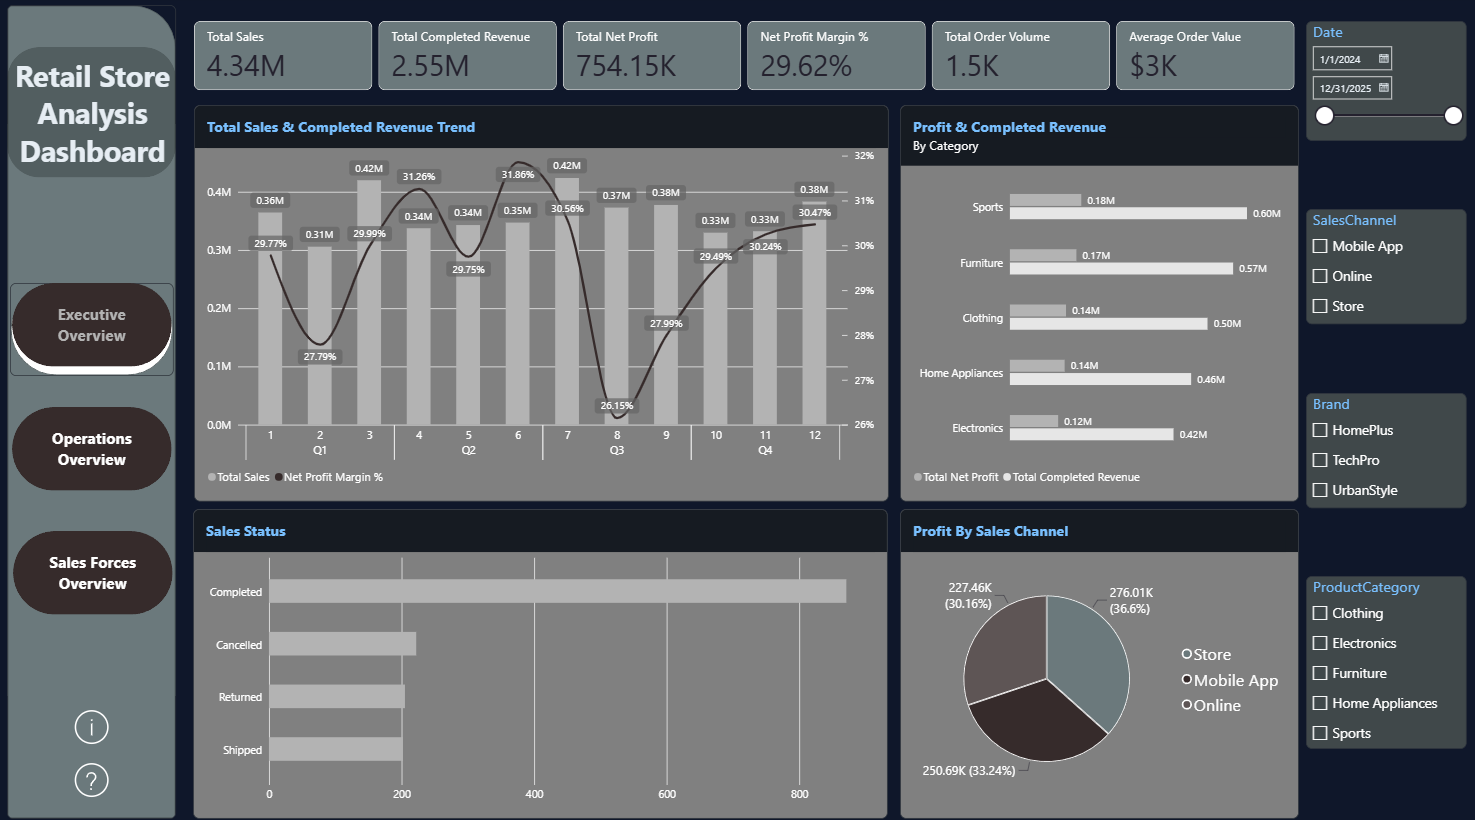
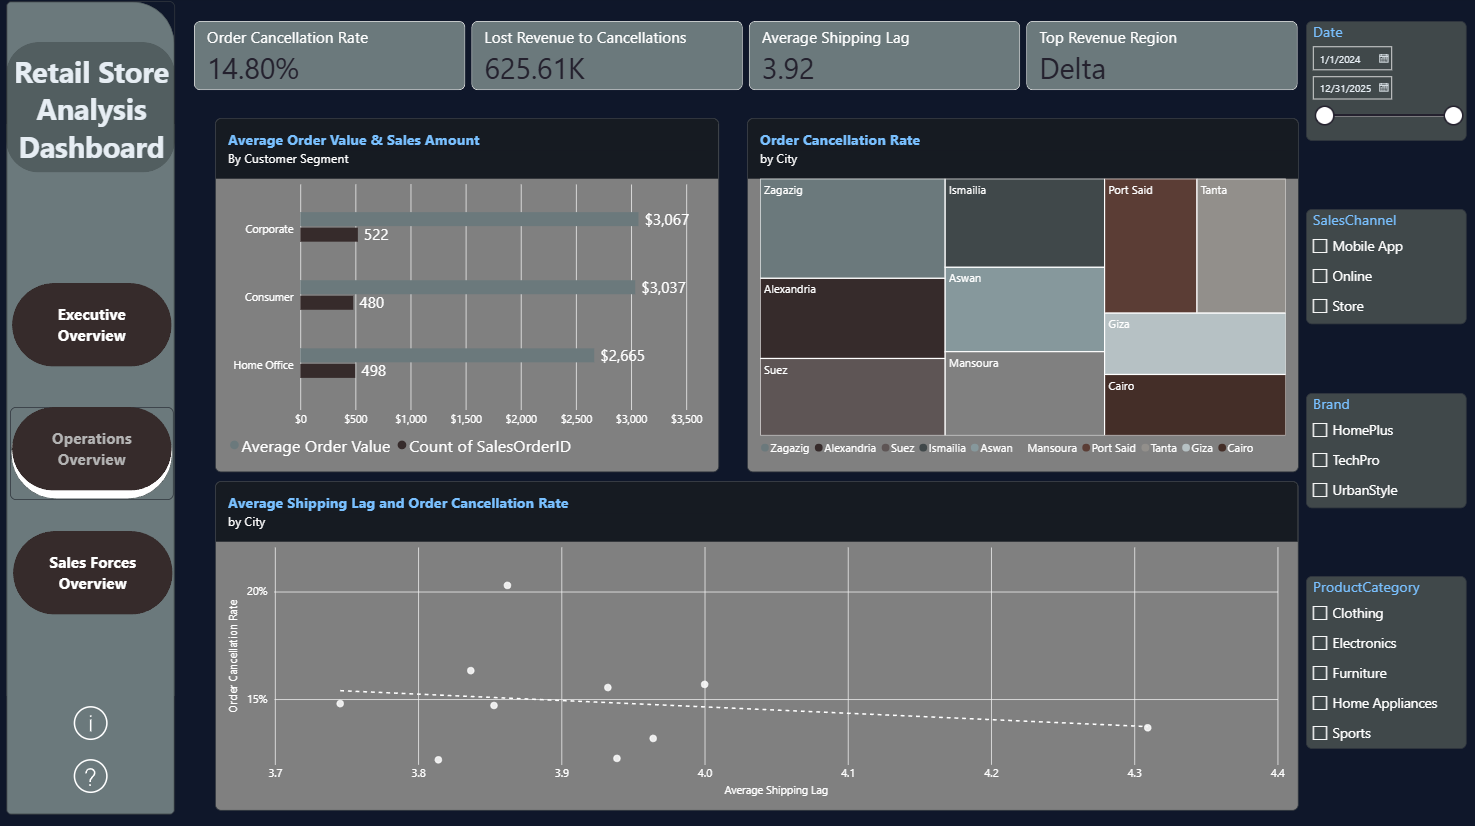
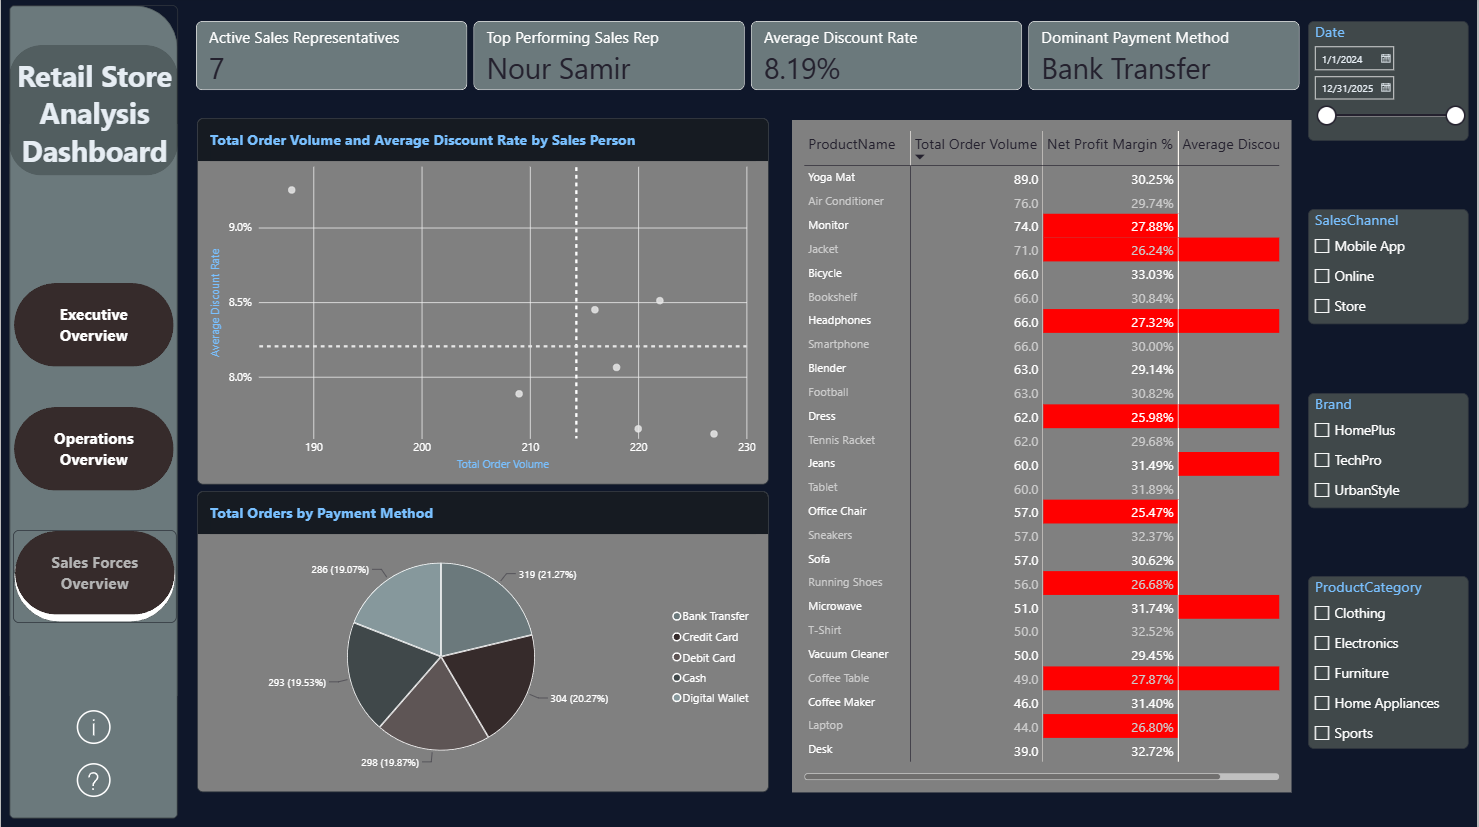
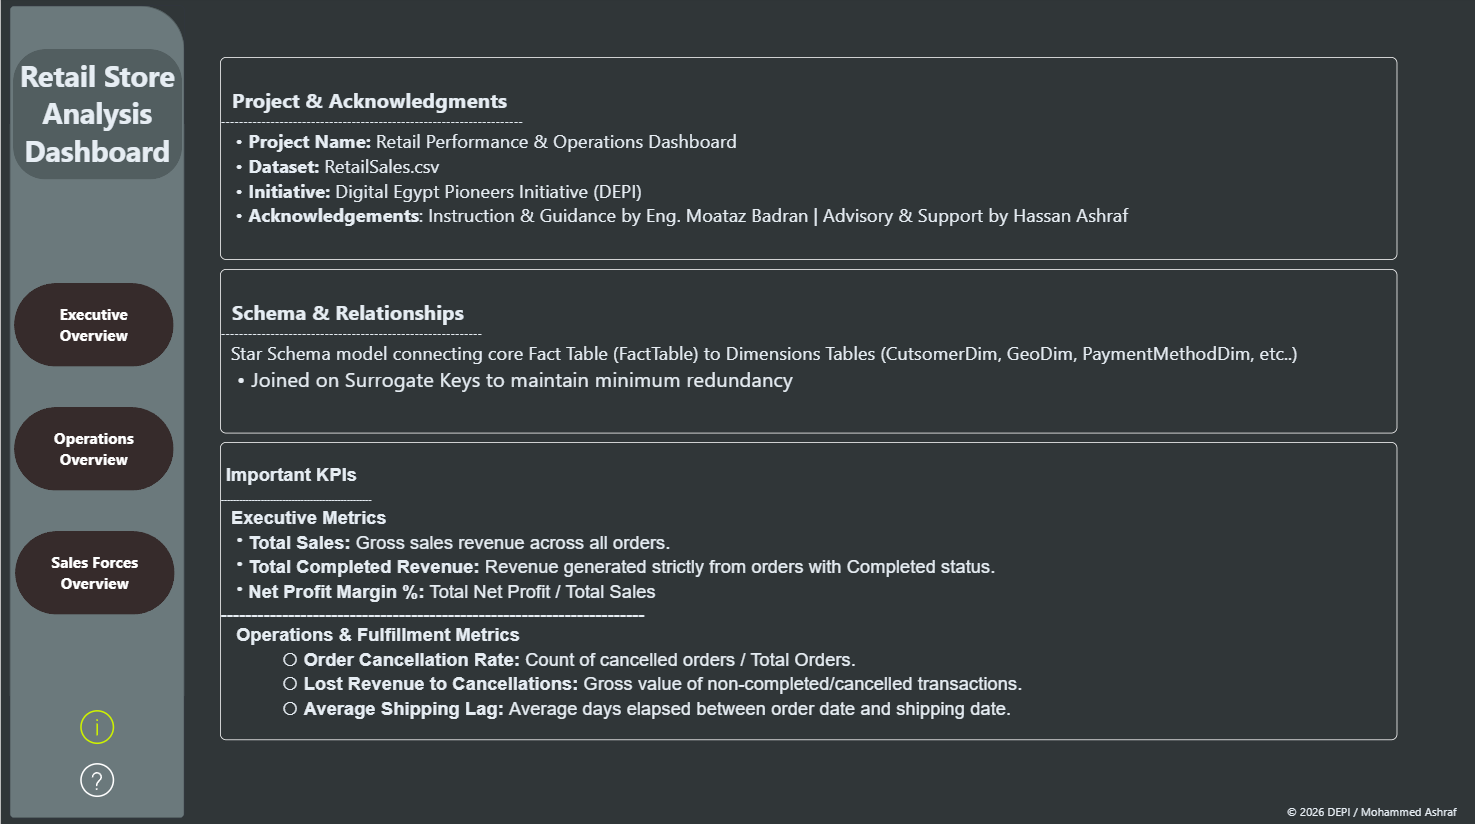
A three-page Power BI report over a cleaned RetailSales dataset, modelled as a star schema joined on surrogate keys: an Executive page for revenue and margin, an Operations page for fulfilment health, and a Sales Force page for rep and product performance. All pages share date, channel, brand, and category filters.
What it revealed
29.62% net profit margin on 4.34M in sales, with margin dipping to 26.15% in Q3 — a seasonal squeeze worth planning around.
14.80% of orders were cancelled, equal to 625.61K in lost revenue: the single biggest recoverable number in the business.
Average shipping lag of 3.92 days showed no strong link to cancellations by city, ruling out delivery speed as the main cause.
Product-level margin flags exposed items selling in volume while earning below-target margin, and discount rates varying by rep up to 9%.
Power BI
Power Query
DAX
Star Schema
Excel
Live report
Report pages
Data model