Data Analysis · Business Intelligence
Mohammed Ashraf Hassan
Data & BI Analyst
I turn messy business data into Power BI dashboards that tell owners and managers exactly where the money is going. Power BI Services Consultant
Cairo, Egypt · Available for remote freelance work
01 — About me
An analyst who starts with your decision, not your data
I'm a Data & BI Analyst who builds the reporting layer that business owners, sales managers, and stakeholders actually use to make decisions. My work starts where most reports fail: with the raw file. I clean it, model it into a proper star schema, define the KPIs that matter, and then design a dashboard that answers a question in one glance instead of five clicks. My background is in Electronics & Communication Engineering, which trained me to break messy systems into measurable parts — the same instinct I now apply to sales, operations, and pricing data. Through the DEPI Junior Data Analysis Track I built three full analytics projects end to end, covering retail performance, flight pricing, and store sales. I'm straightforward to work with: I ask what decision you need to make, then build the shortest path to it. No 40-page decks, no vanity charts.
- Clear KPI definitions agreed before a single chart is built
- Star-schema models so numbers never double-count
- Reports designed for one-glance answers on desktop and mobile
- Documented work you can hand to the next person
02 — Education
Training and background
B.Sc. Electronics & Communication Engineering
Institute of Aviation Engineering and Technology (IAET)
Engineering degree with a strong quantitative and systems-analysis core.
Junior Data Analysis Track
Digital Egypt Pioneers Initiative (DEPI)
Applied training in SQL, Excel, Power Query, data modelling, and Power BI.
03 — Skills
The toolkit behind every report
Analysis & Insight
- Data Analysis
- KPI Definition
- Trend & Variance Analysis
- Root-Cause Breakdown
Visualization & Reporting
- Power BI
- Data Visualization
- Dashboard Design
- Executive Reporting
Data Preparation
- Data Cleaning
- Power Query
- Excel
- Star-Schema Data Modelling
Querying
- SQL
- Joins & Aggregations
- DAX Measures
04 — Work experience
Where the hands-on work comes from
- Build Power BI dashboards and clean, modelled datasets for business owners and sales teams.
- Take projects from raw CSV to a decision-ready report, including KPI definitions and documentation.
- Completed a structured analytics track covering SQL, Excel, Power Query, data modelling, and Power BI.
- Delivered the Retail Performance & Operations Dashboard as the capstone project, guided by Eng. Moataz Badran with advisory support from Hassan Ashraf.
05 — Projects
Selected builds, from raw file to decision
Each project shows the report pages and the data model underneath. Tap any image to view it full size.
Retail Performance & Operations Dashboard
The question
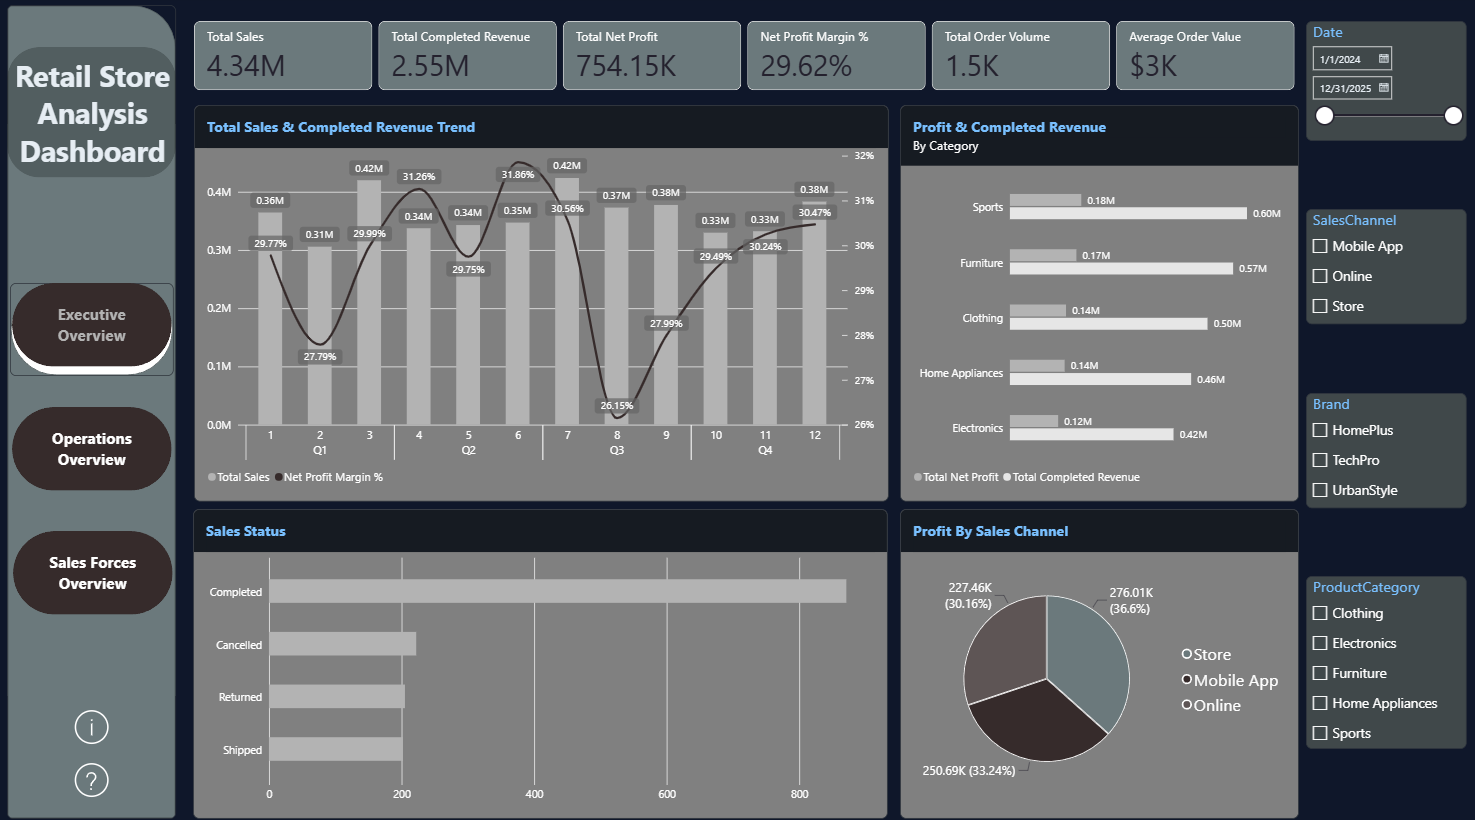
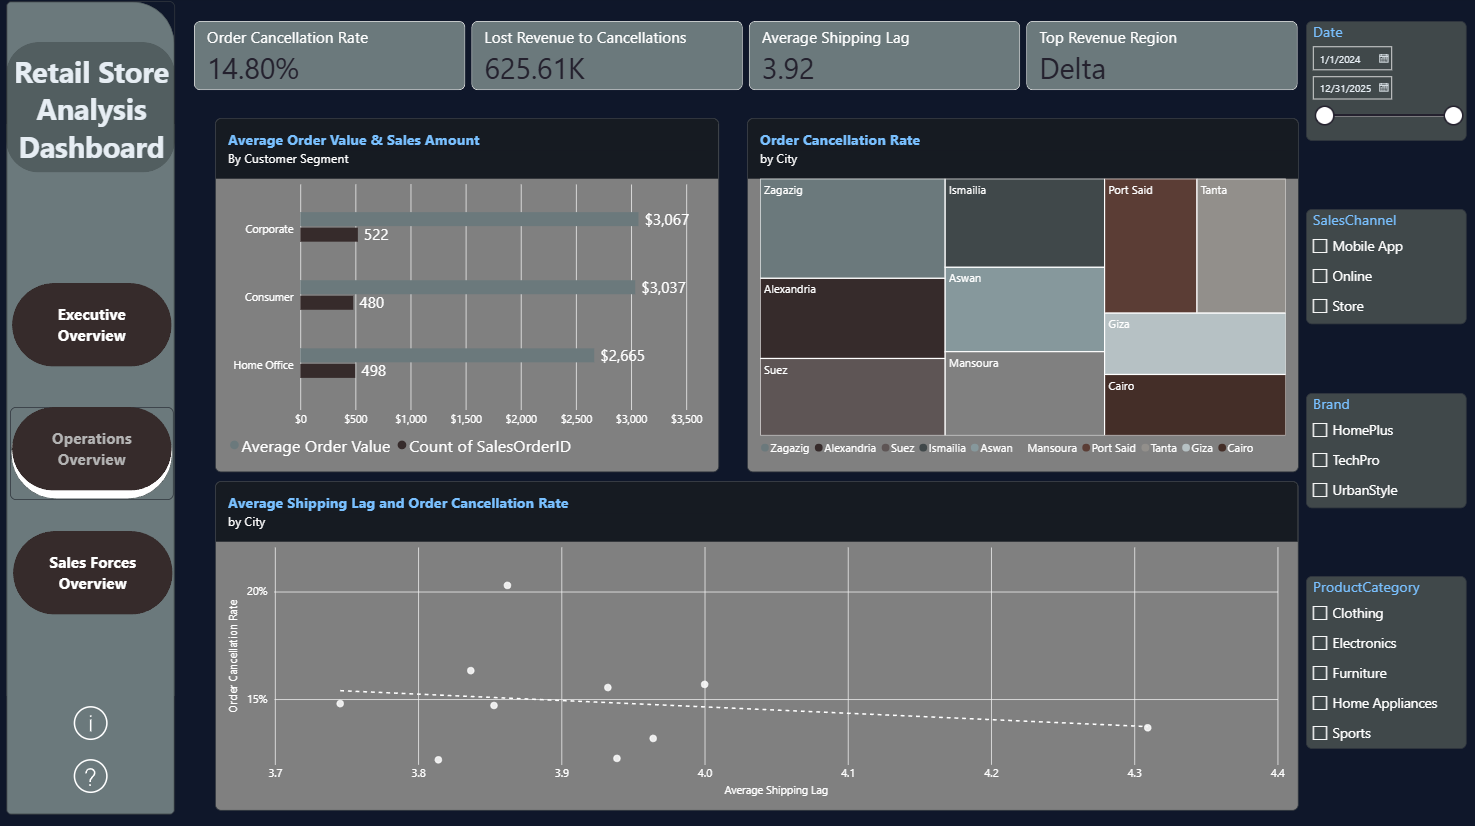
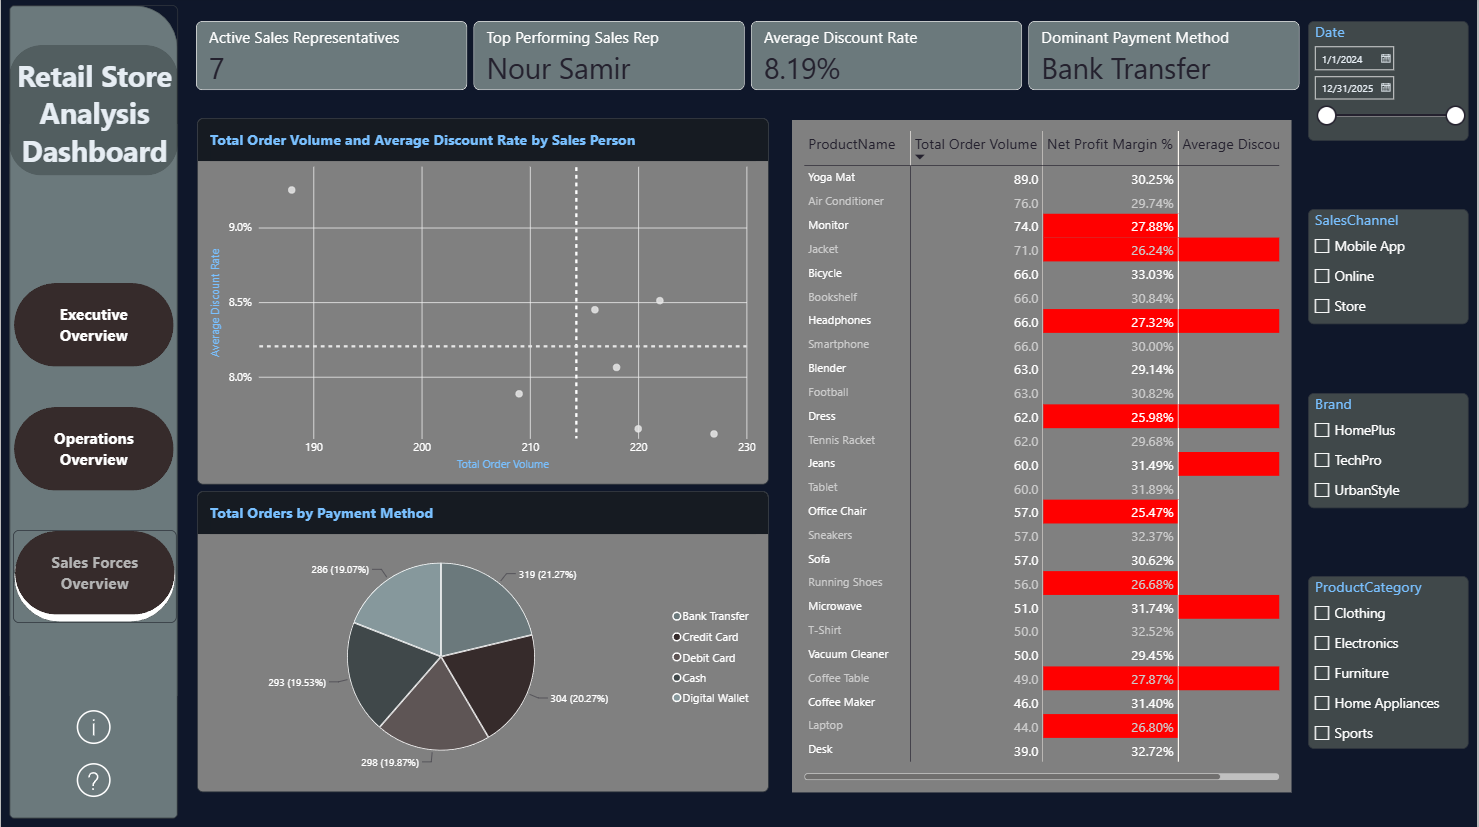
A retail business could see its revenue but not what was quietly draining it — cancelled orders, slow shipping, and discount-heavy sales reps.
What I built
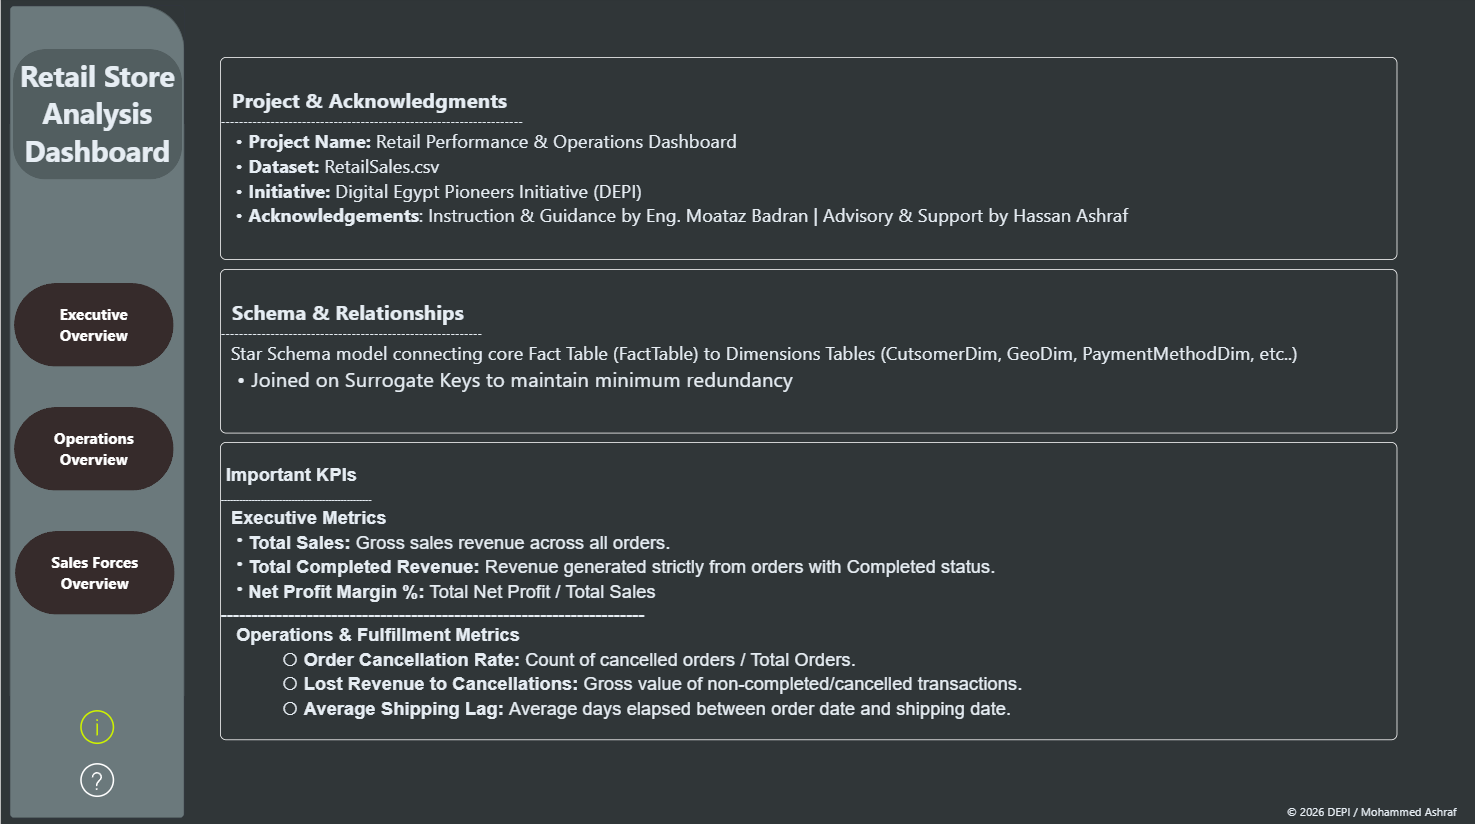
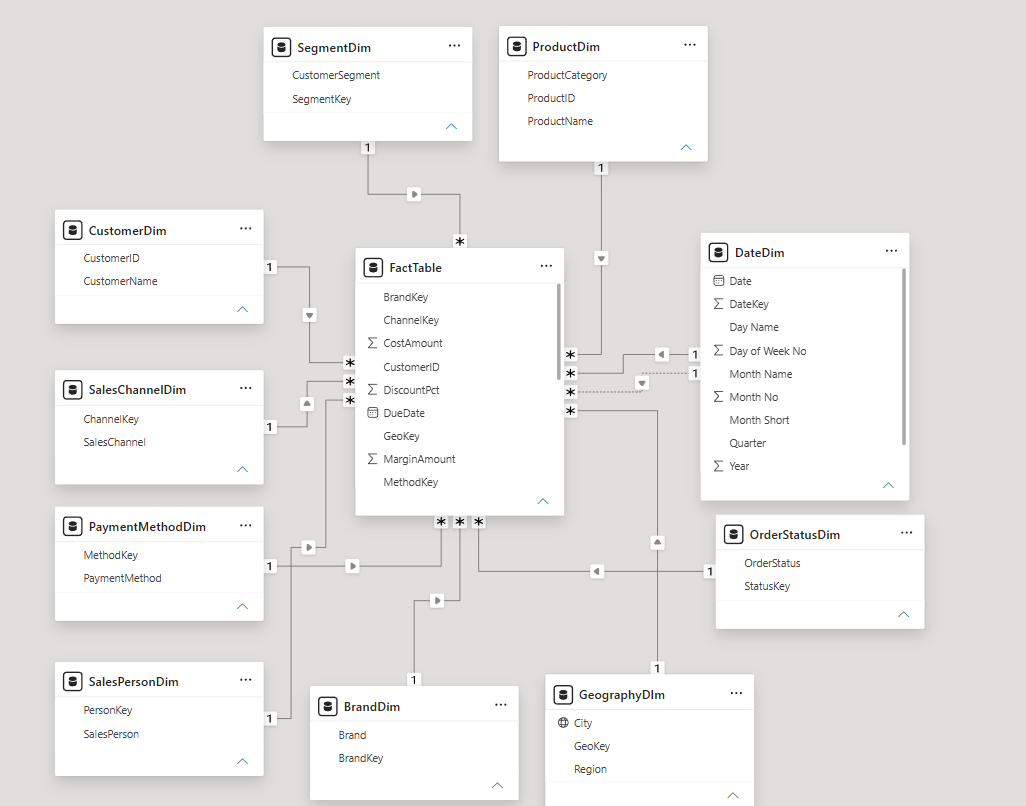
A three-page Power BI report over a cleaned RetailSales dataset, modelled as a star schema joined on surrogate keys: an Executive page for revenue and margin, an Operations page for fulfilment health, and a Sales Force page for rep and product performance. All pages share date, channel, brand, and category filters.
What it revealed
Live report
Report pages
Data model
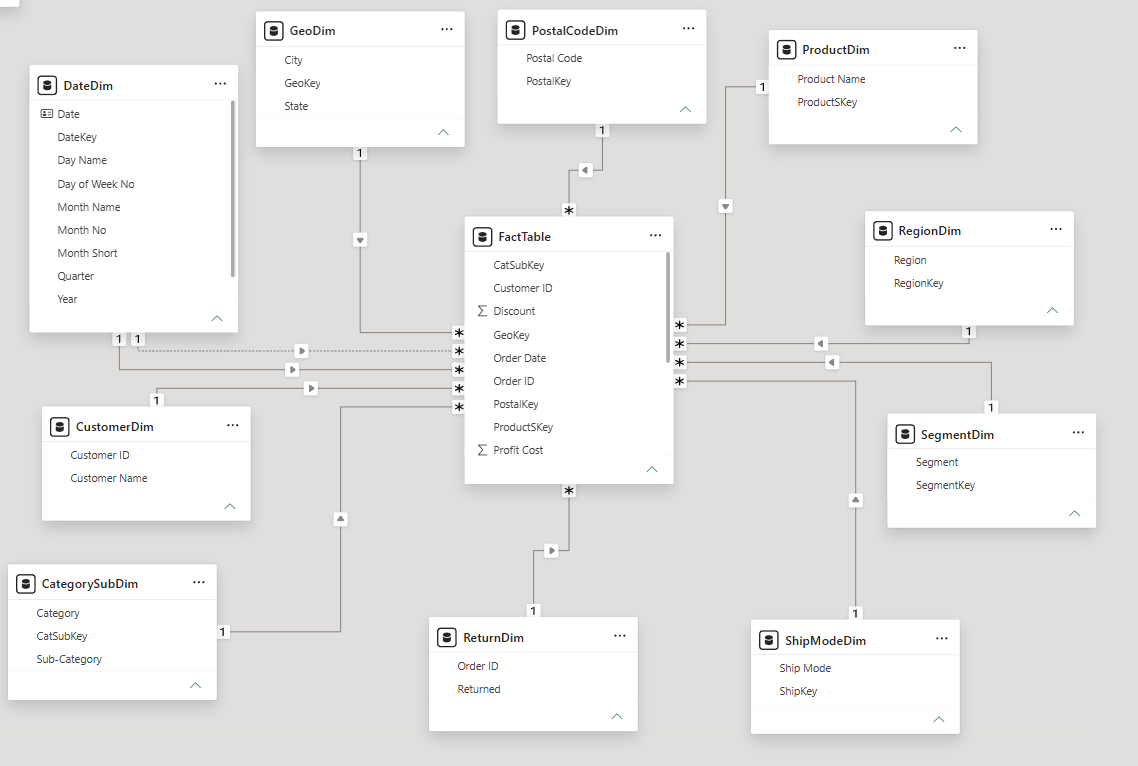
Superstore Analytics
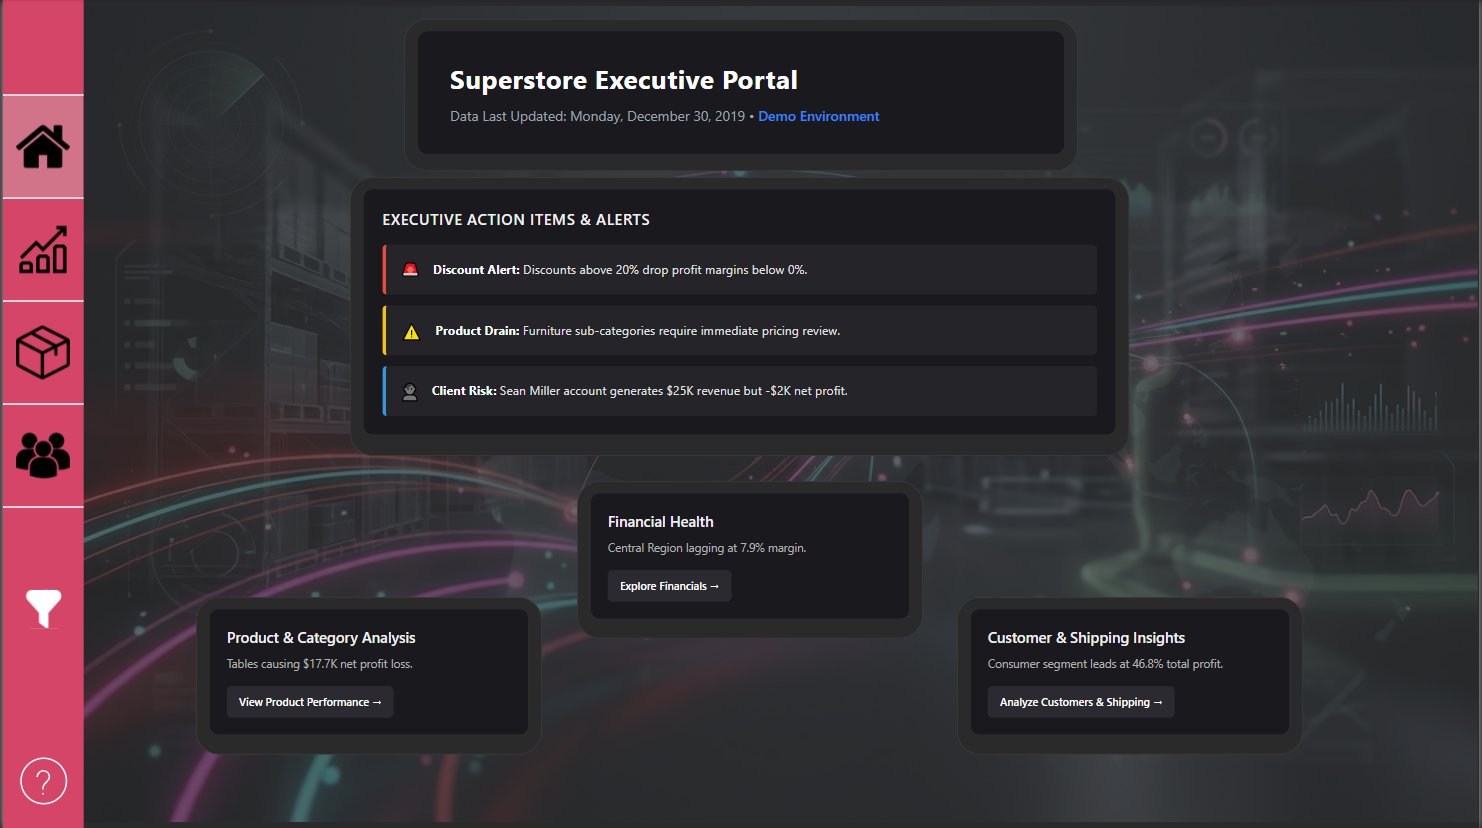
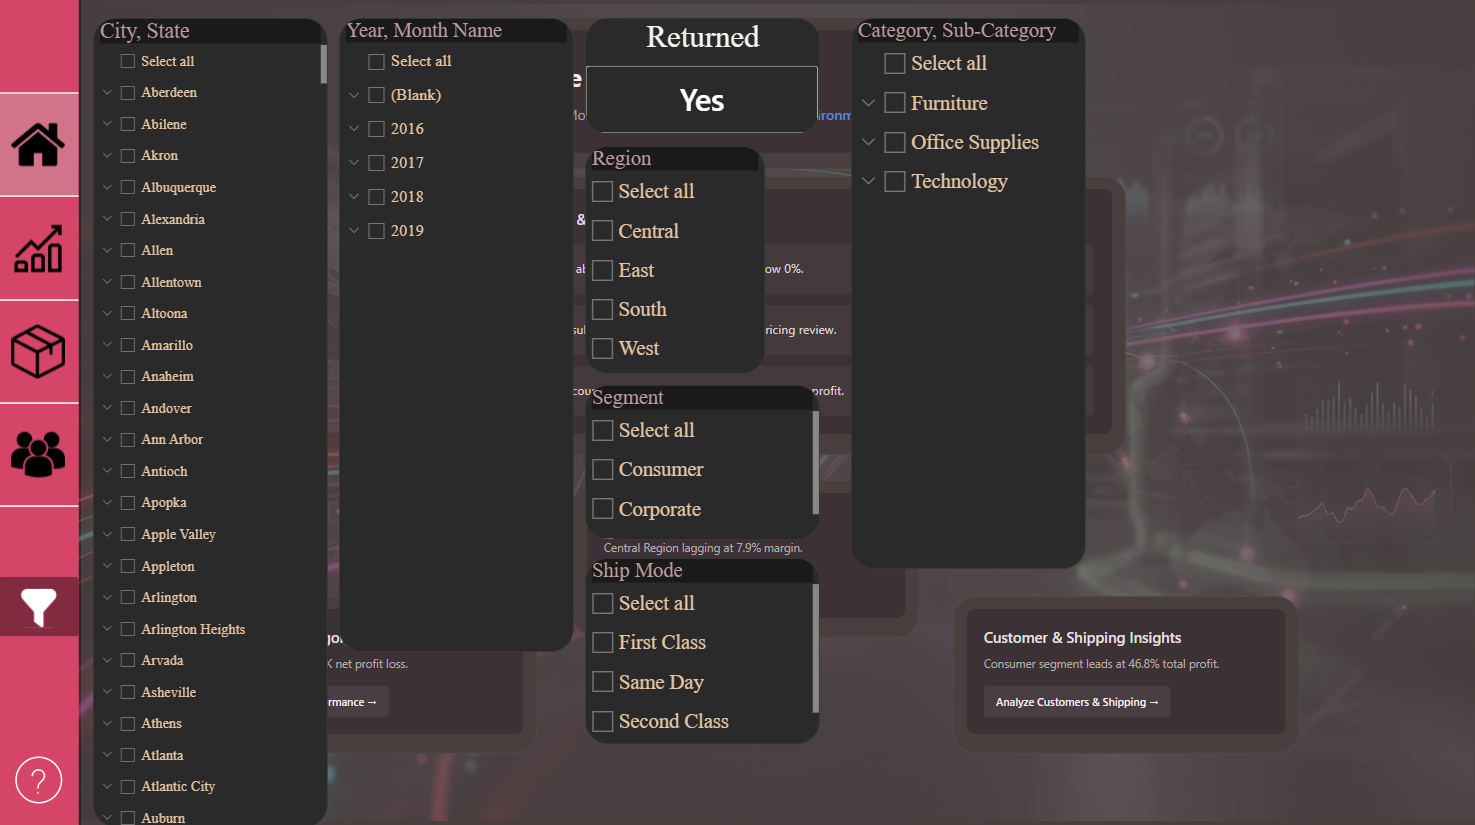
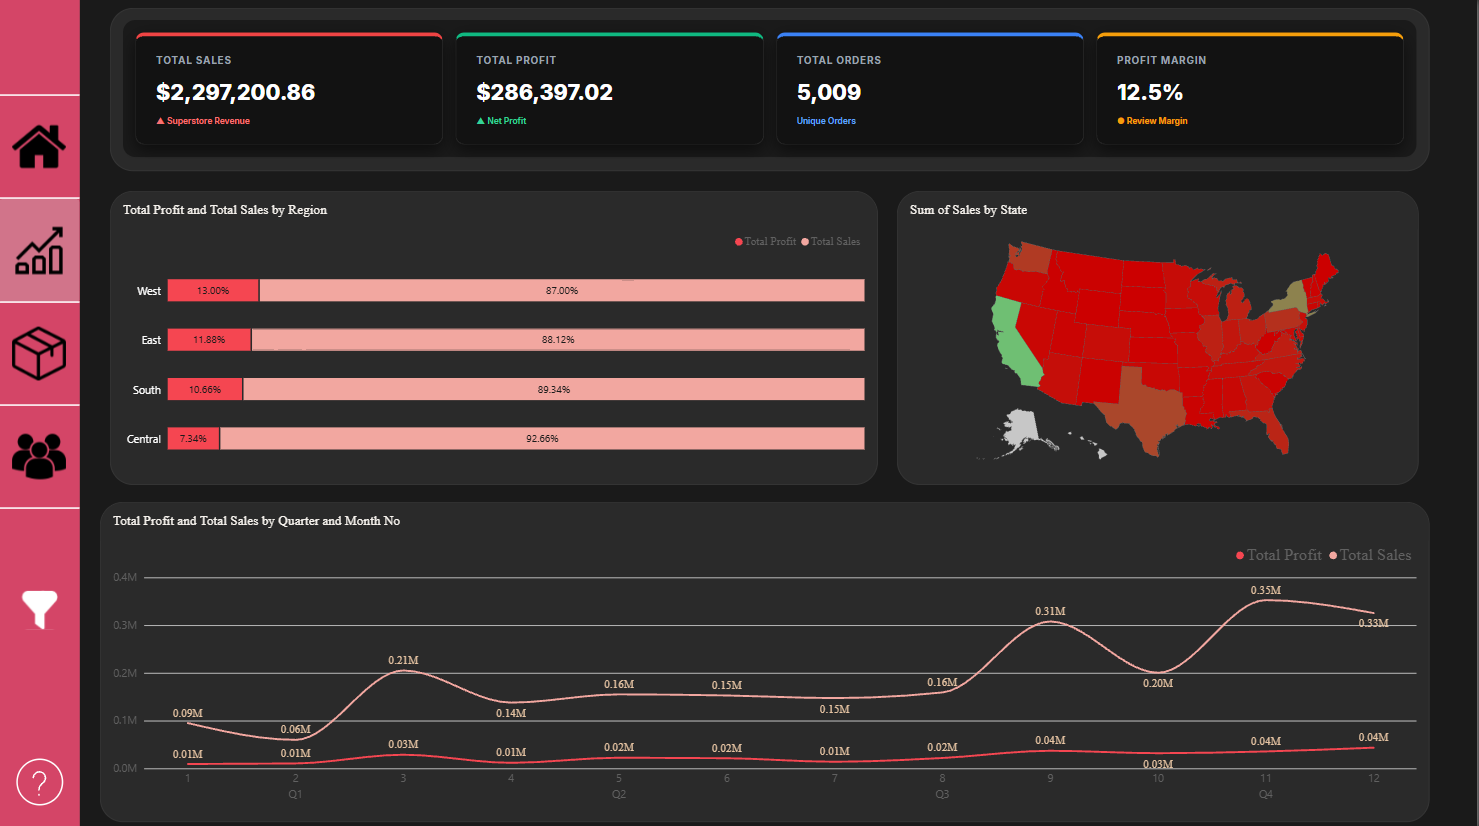
Designed and developed a high-end, multi-page "Clean Dark" Executive Dashboard for retail performance tracking using Power BI and a robust star schema data model. Built to prioritize rapid executive digestion, the portal features a dynamic home landing page with custom HTML/CSS alert cards, transparent button navigation overlays, and real-time KPI monitoring. Key findings uncovered critical operational insights: while product categories like Phones and Copiers drive strong revenue, specific sub-categories like Tables and Bookcases incur heavy net losses, and aggressive discounting past 20% severely erodes profit margins below zero. The dashboard also highlights customer segmentation trends—where the Consumer segment commands 46.8% of total profit—and isolates key account risks to drive immediate executive action.
Live report
Report pages
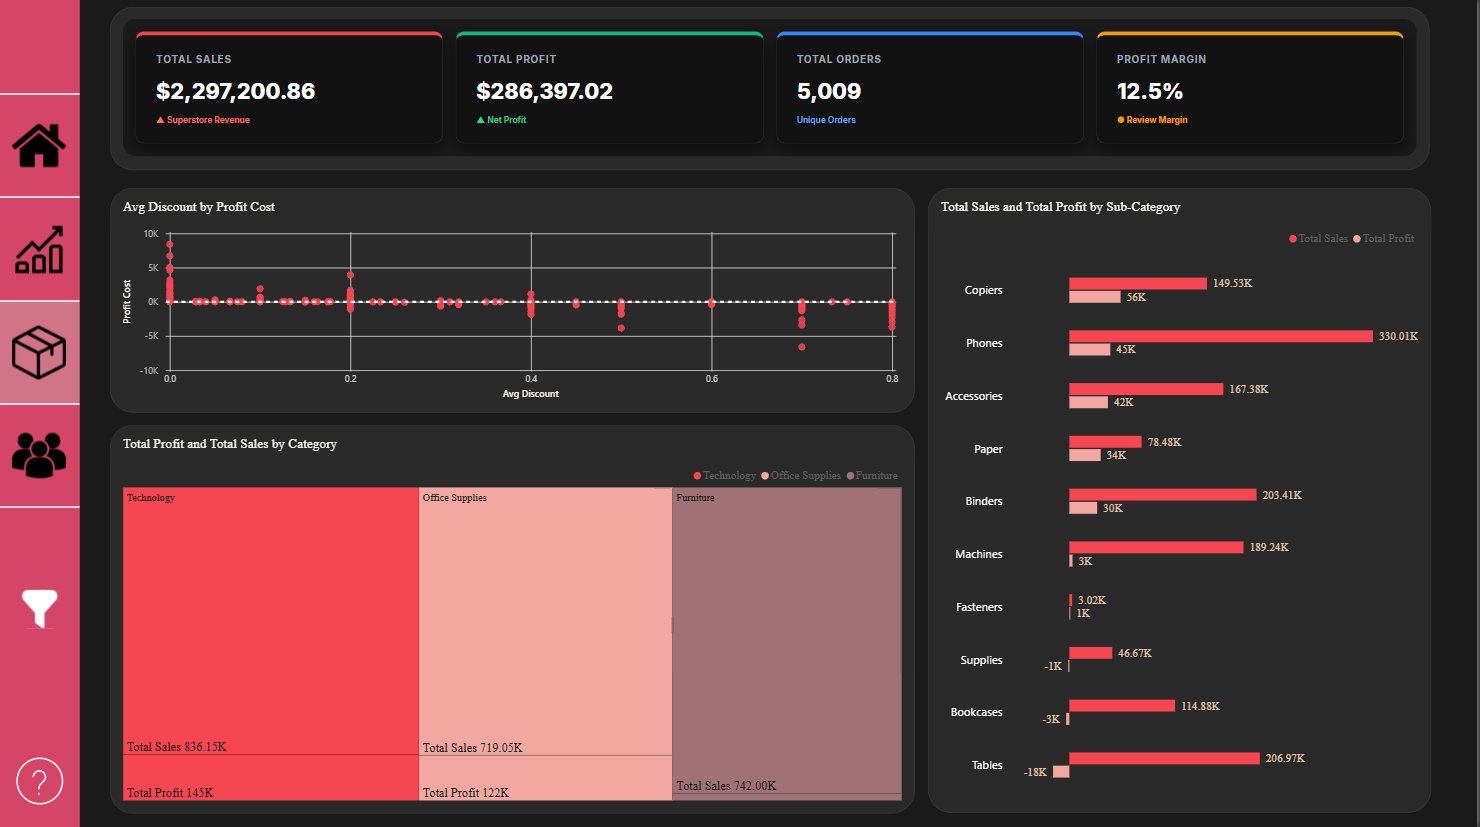
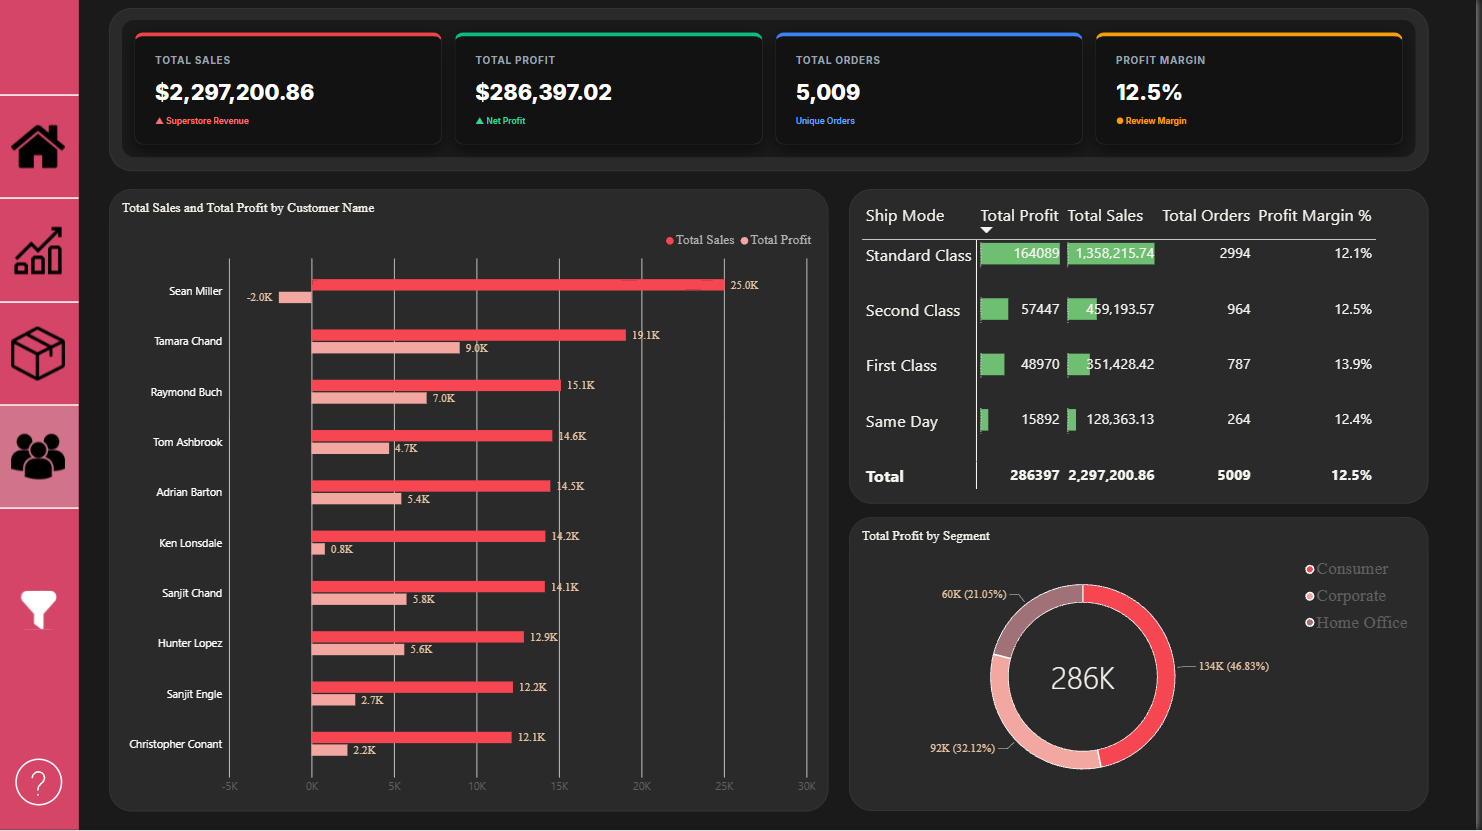
Data model
Flight Tracking DB
The question
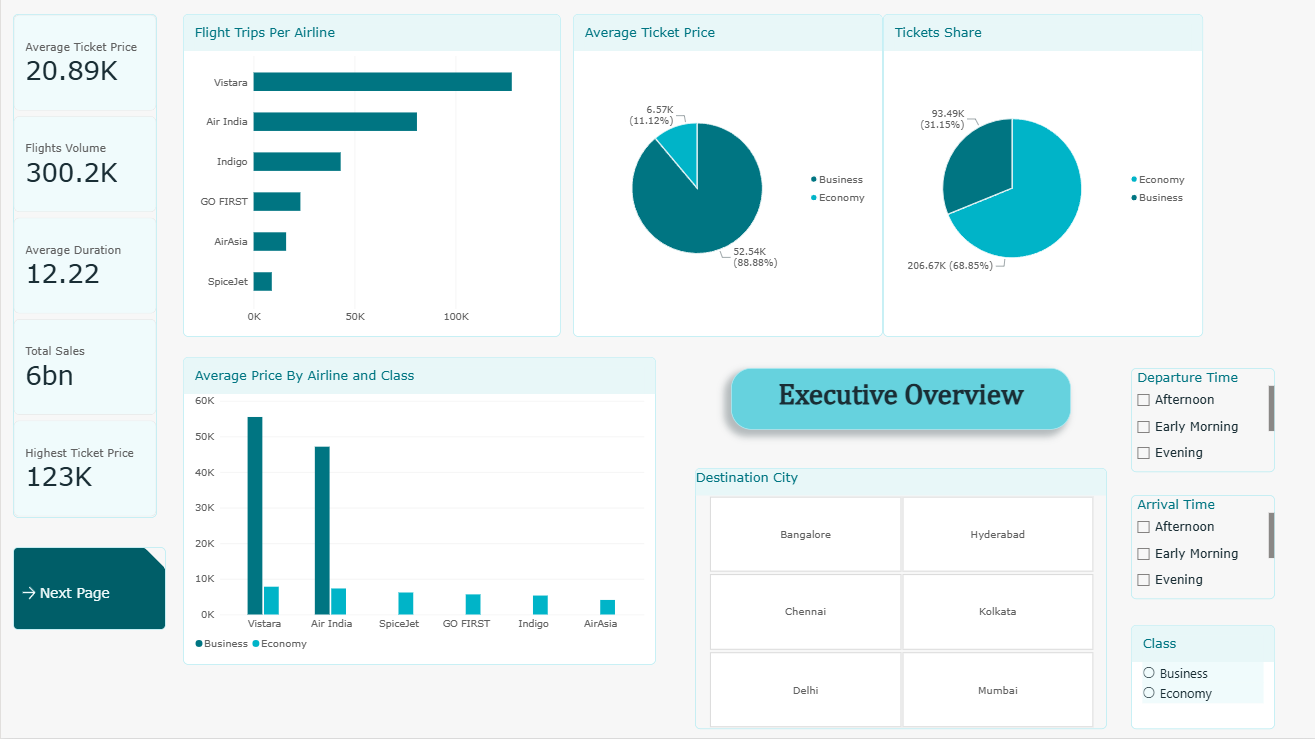
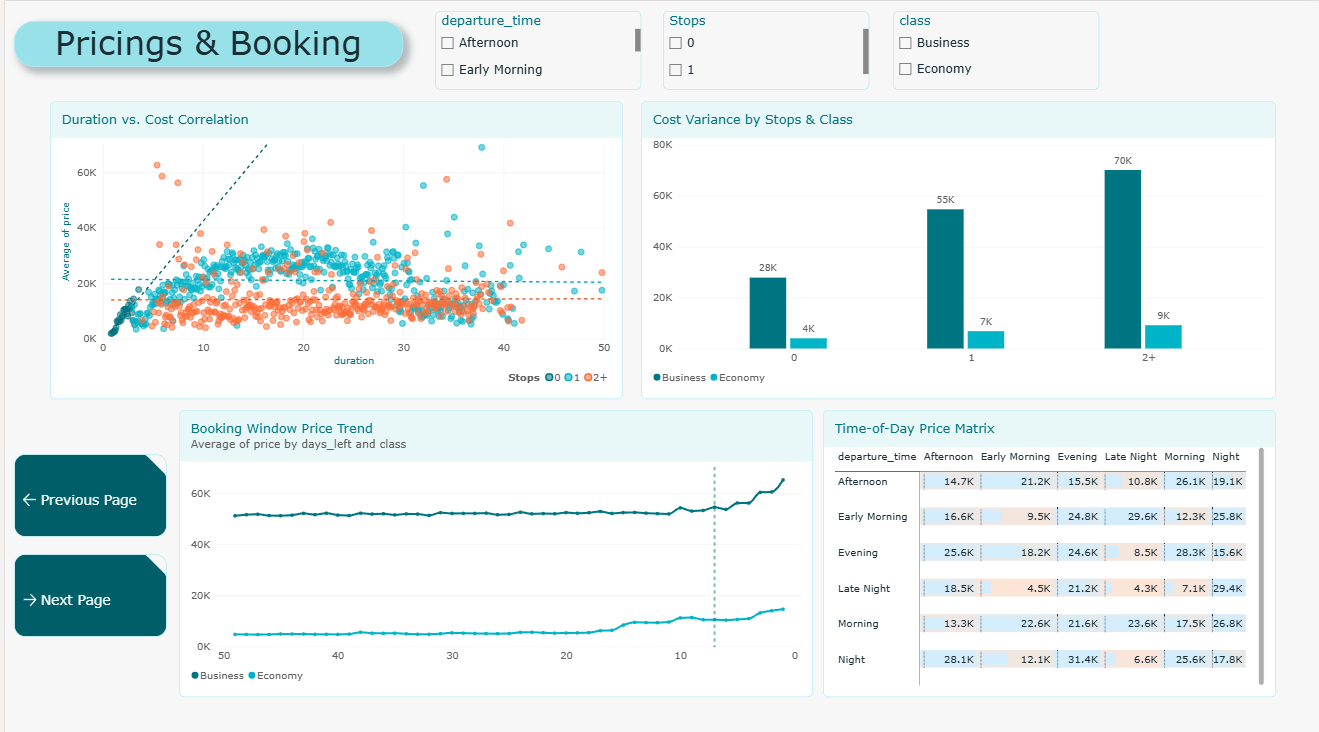
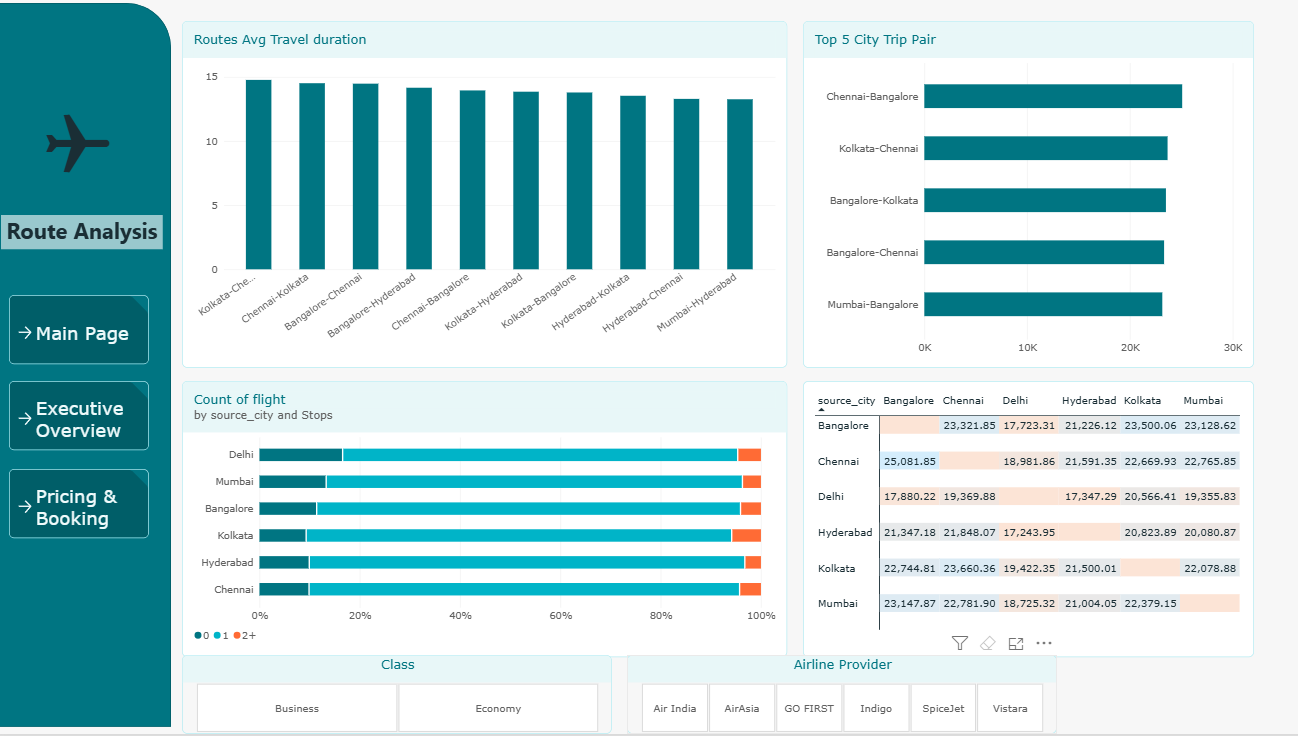
With 300K flight records, which airlines, cabin classes, and booking windows actually drive ticket price — and where does price stop being about distance?
What I built
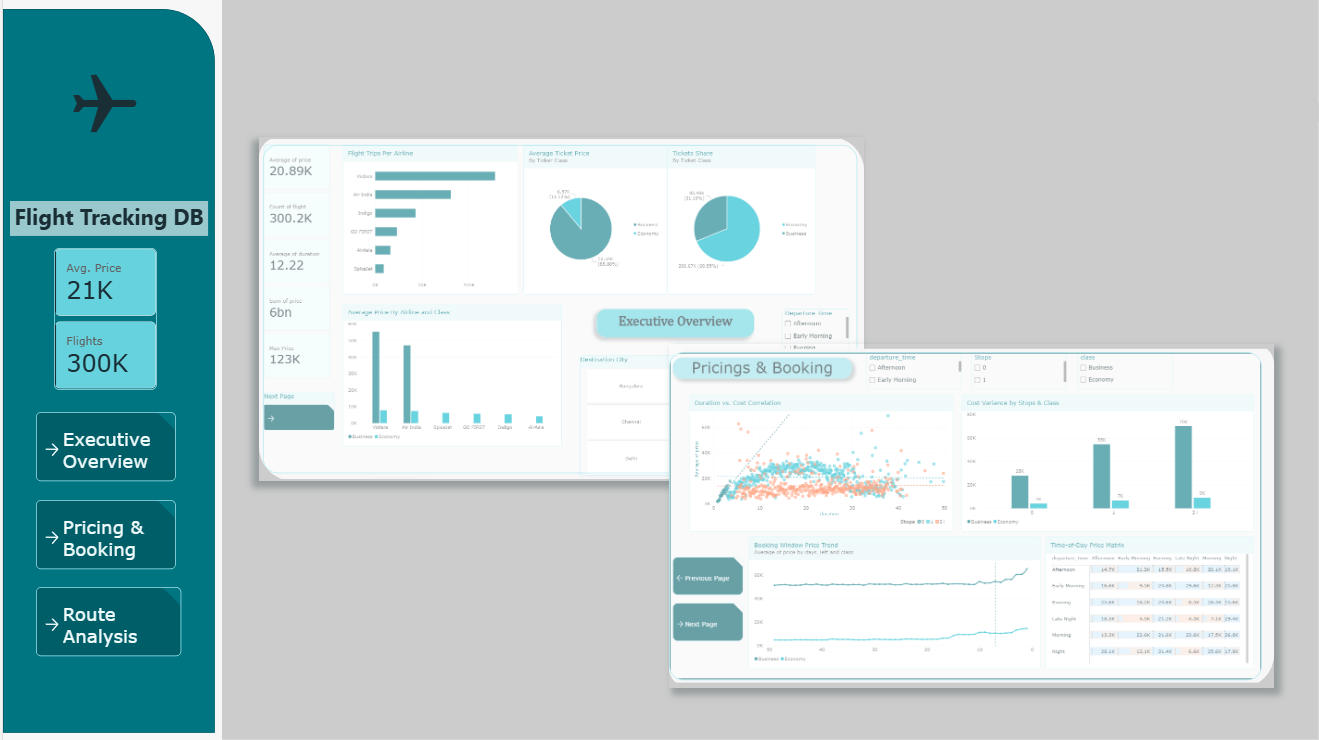
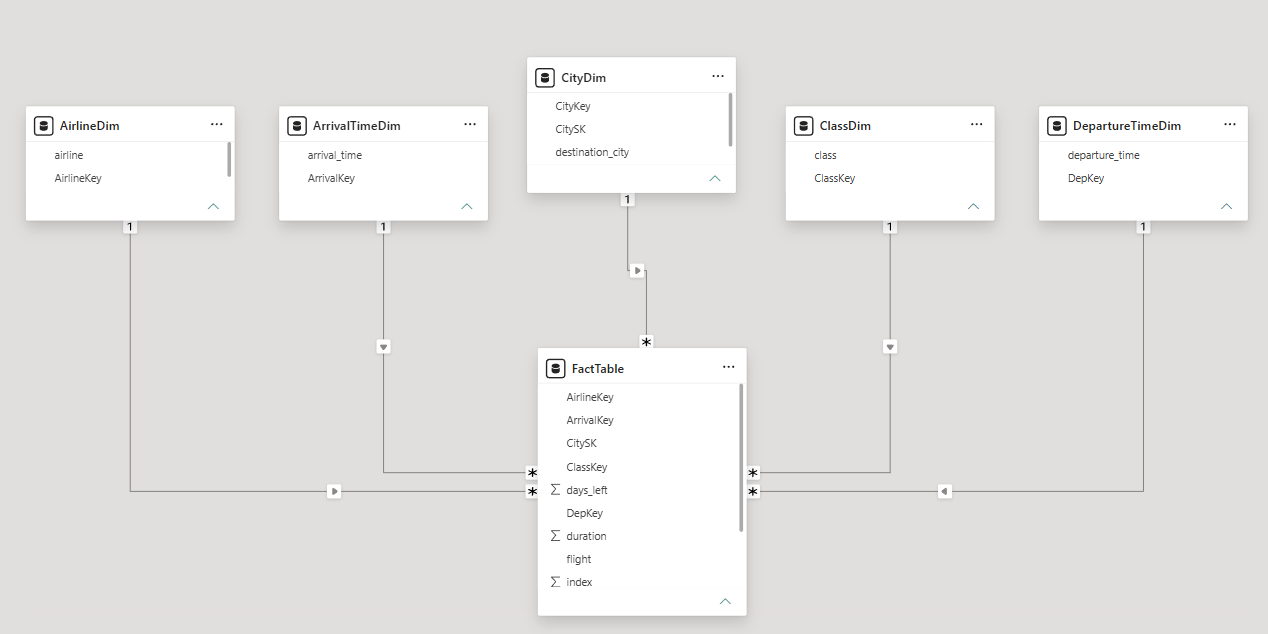
A three-page Power BI report on a star-schema model with airline, city, class, departure-time, and arrival-time dimensions. Pages cover an executive summary, a pricing and booking deep dive with correlation analysis, and a route-level view.
What it revealed
Report pages
Data model
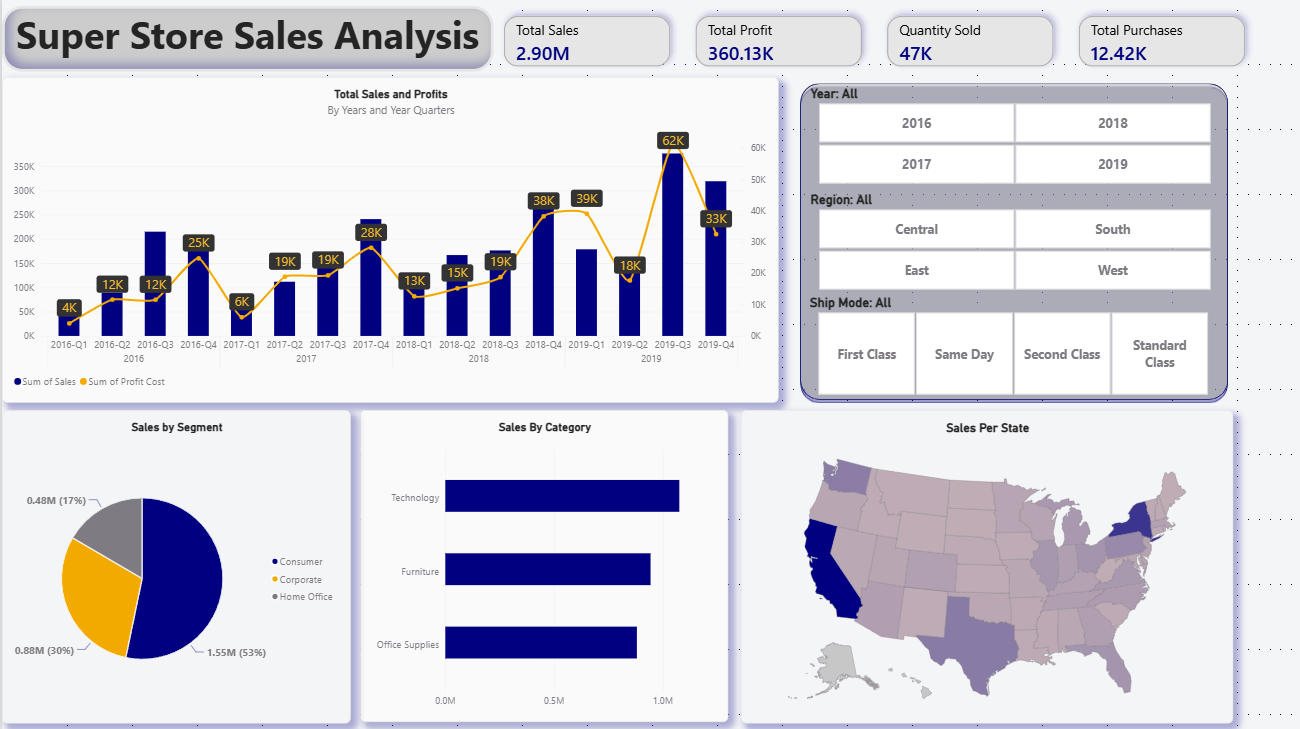
Super Store Sales Analysis
The question
Across four years of orders, which segments, categories, and states actually carry profit — and is the trend improving or just noisier?
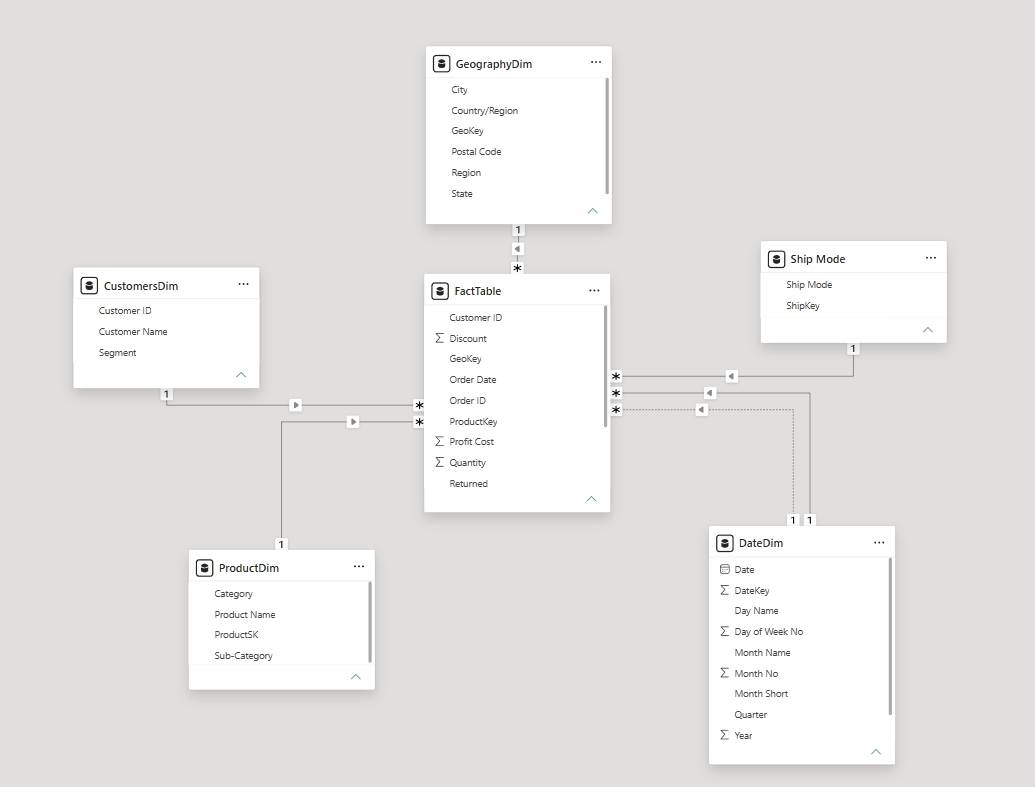
What I built
A single-page executive sales dashboard over a star-schema model with customer, product, geography, date, and ship-mode dimensions, filterable by year, region, and shipping method.
What it revealed
Document
Report pages
Data model
Let's work together
Tell me the decision you're stuck on. I'll build the dashboard that answers it.
Send over your data file or a short description of your reporting problem. You'll get a plain answer on scope, timeline, and what the finished report will show — no obligation.