
New Moon0% lit

Projects Power BI

HR Analytics & Workforce Insights Dashboard

Lead project

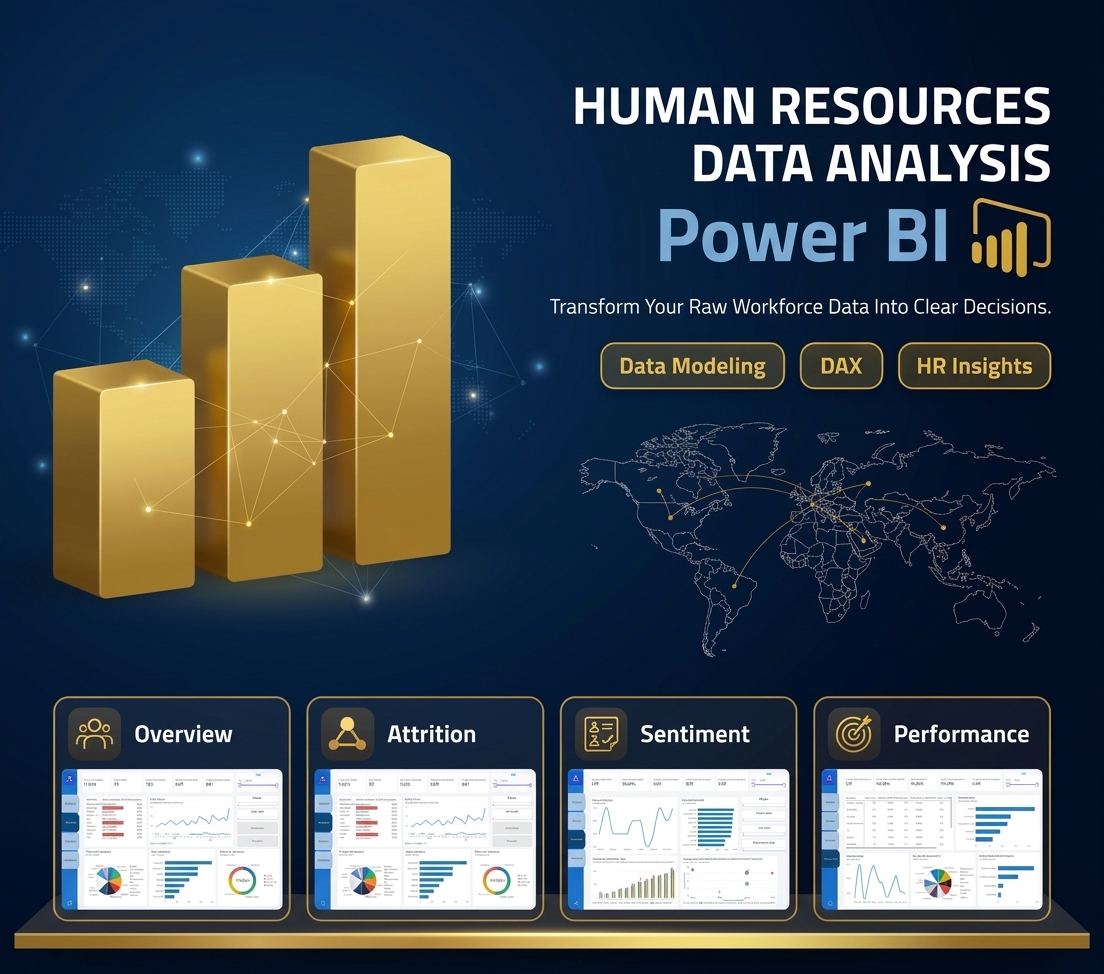
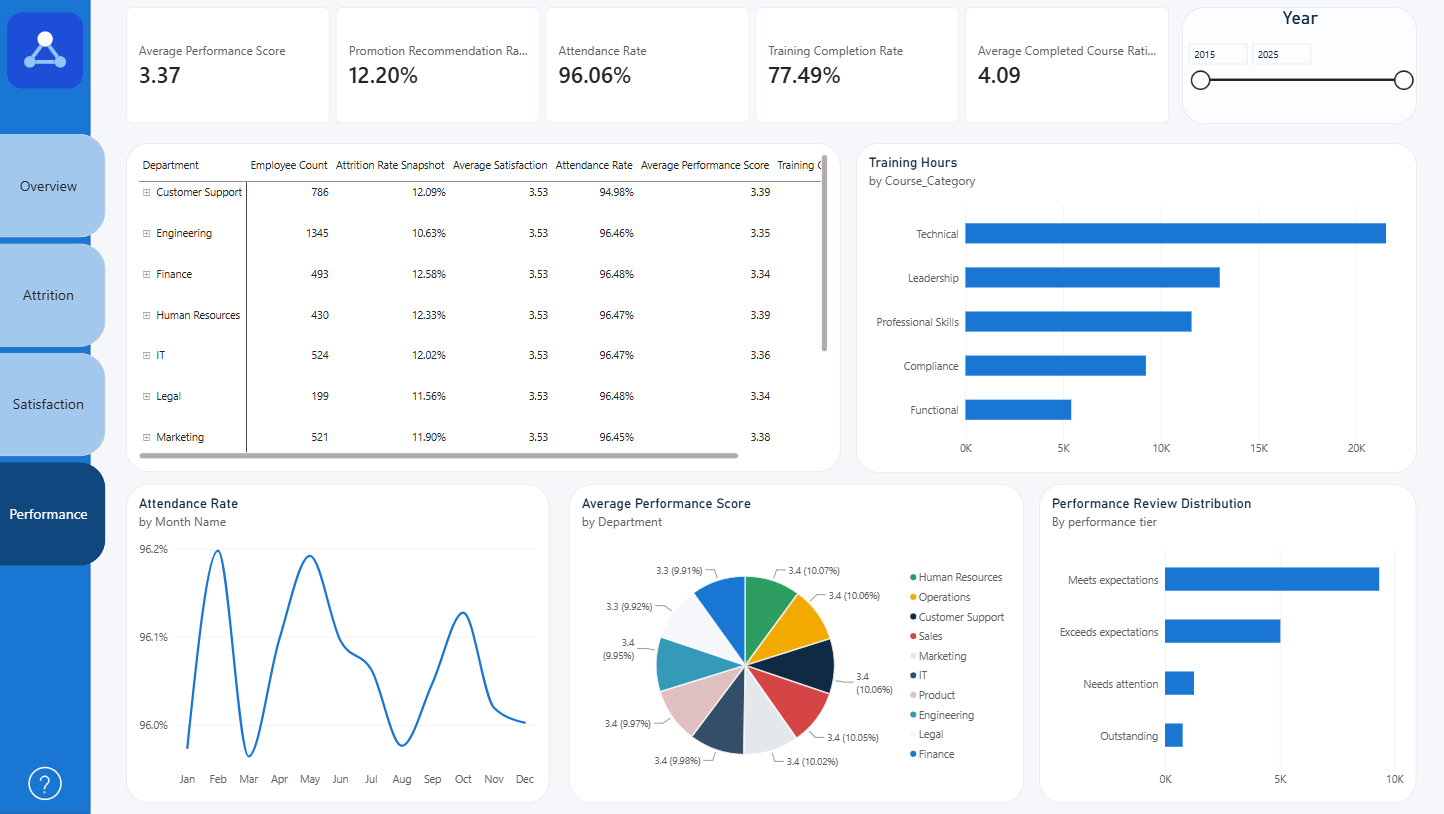
An interactive Power BI HR Analytics dashboard providing executive oversight into workforce demographics, employee attrition, sentiment, and performance metrics. Built to empower data-driven HR decisions and talent management.

A project by Mohammed Ashraf Hassan

Published
Type
Power BI
Built with
Power BI Power Query DAX
HR Analytics & Workforce Insights Dashboard project picture
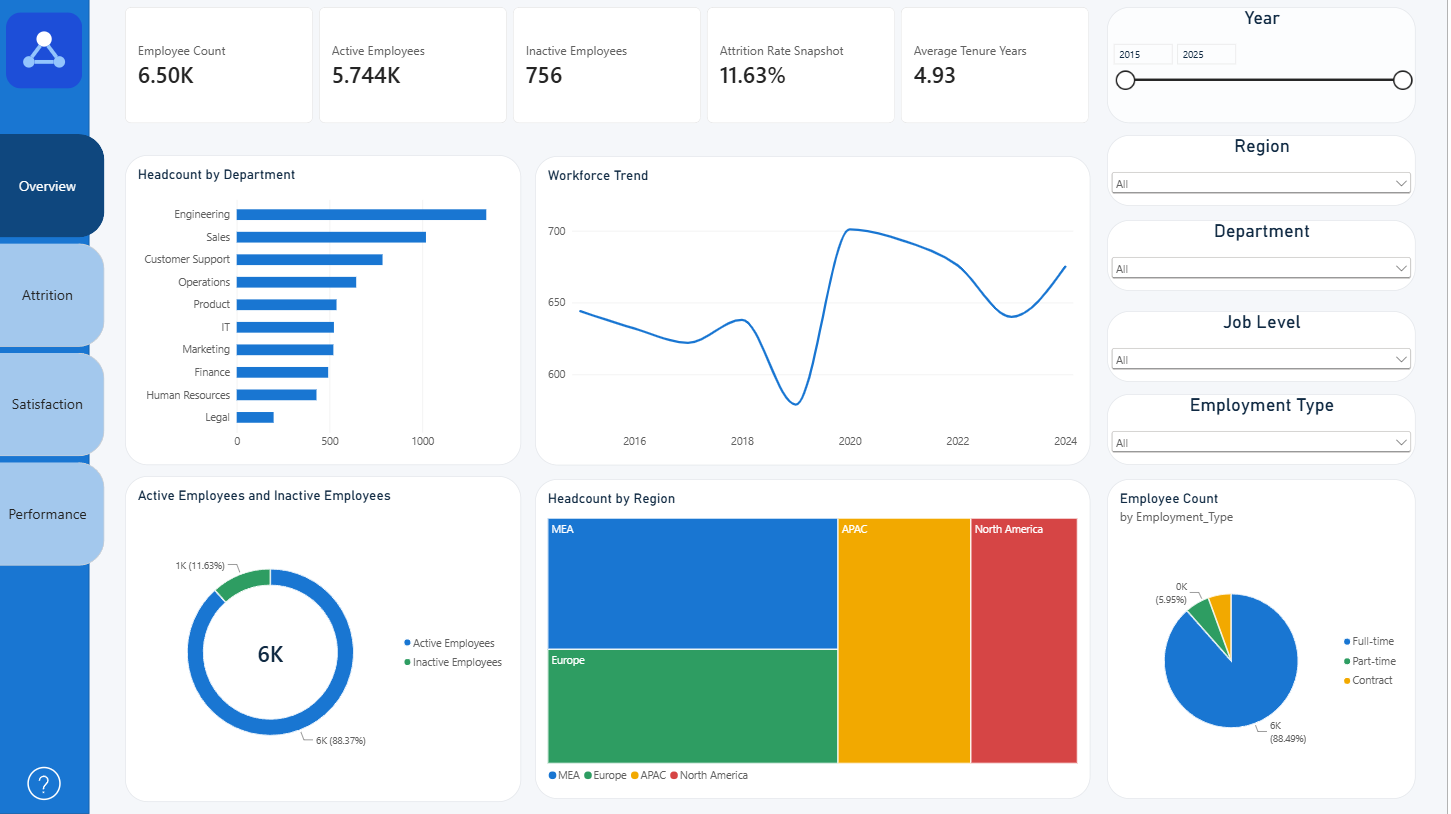
Total Workforce Headcount
6.50K
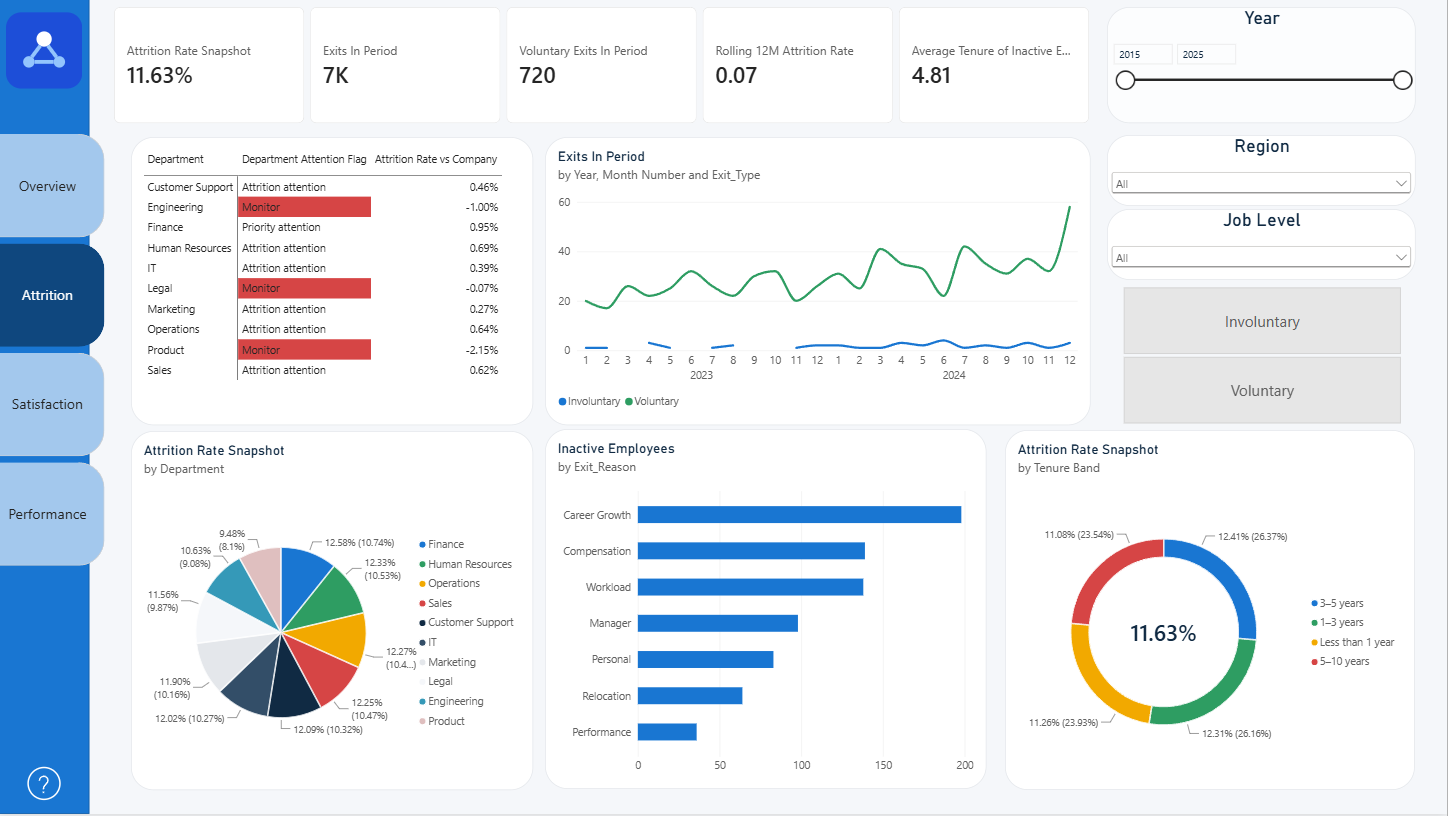
Annual Attrition Rate
11.63%
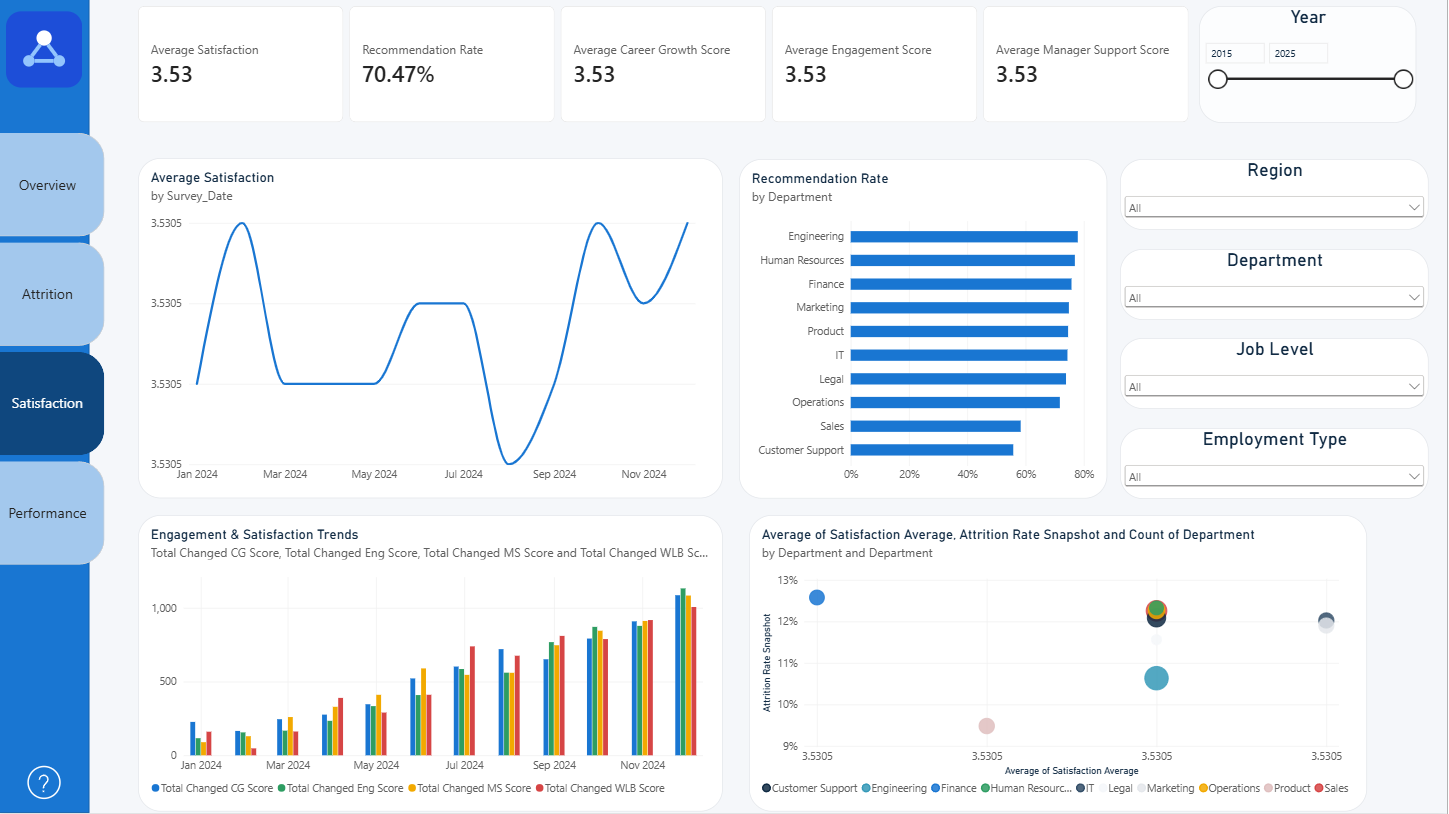
Average Employee Satisfaction
3.53 / 5
Average Attendance Rate
96.06%

HR Analytics Deep Dive

01 · Waxing Crescent · 10% lit

Challenge

How can data modeling and interactive reporting in Power BI identify and diagnose critical HR challenges across our global workforce?

Approach

I developed a comprehensive, 4-page Power BI HR Analytics Dashboard focusing on Workforce Overview, Attrition, Employee Sentiment, and Performance. By connecting and modeling diverse HR data sources, I built an interactive executive-level report designed for intuitive navigation and data-driven decision-making.

Outcome

  1. Workforce Demographics: Identified uneven employee distribution across regions and departments, which helps with future resource planning.
  2. Attrition Diagnosis:pinpointed specific exit reasons and tenure bands where turnover is highest (e.g., < 1 year voluntary), creating immediate focal points for retention strategies.
  3. eNPS and Sentiment Correlation: Correlated a low employee Net Promoter Score (eNPS) with specific satisfaction drivers, such as career growth, enabling a targeted approach to improvement.
  4. Training Gaps: Highlighted departments with lower training completion rates despite having average performance scores, suggesting a need for increased development focus.

Data Model & Architecture

03 · Waxing Gibbous · 90% lit
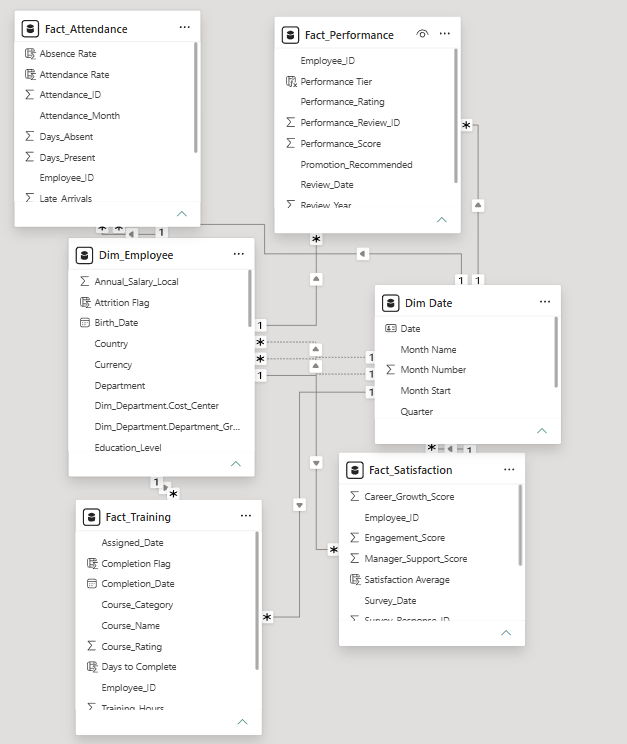
Data Model & Architecture
Star schema model connecting workforce facts with department, region, date, and employee dimension tables.

Tools

04 · Waning Gibbous · 98% lit

Tools

Power BI Power Query DAX

Keep exploring.

05 · New Moon · 0% lit
Previous project

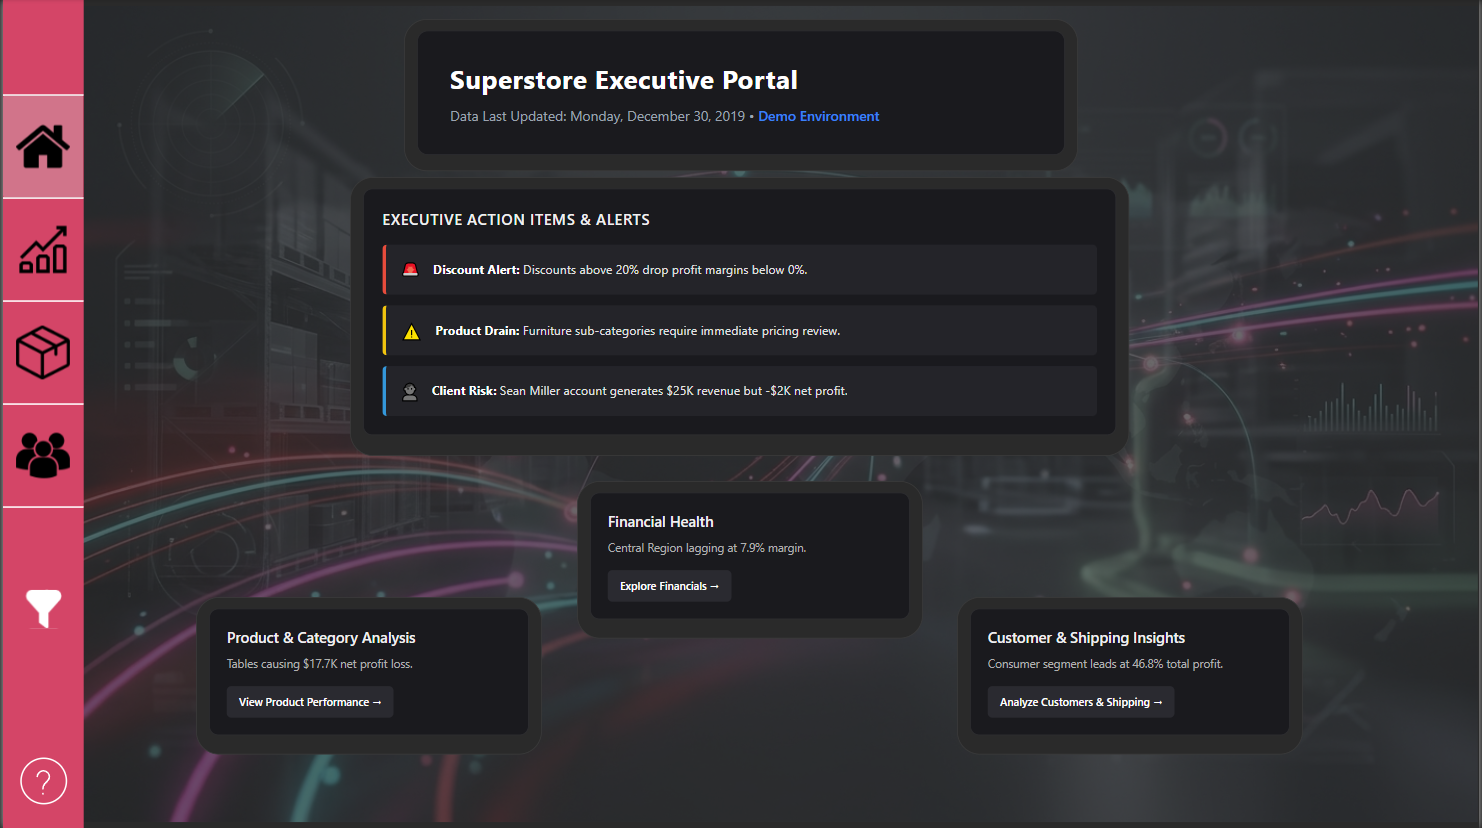
Superstore Executive Intelligence Portal

Data Analytics & BI

Developed an interactive Power BI Executive Portal to track financial health, product profitability, and customer risks. Built: A multi-page dashboard featuring automated alert cards, regional financial tracking, category/shipping drill-downs, and a comprehensive slicer filter panel. Found: Discounts over 20% destroy profit margins; the Tables sub-category loses -$18K despite high revenue; and certain high-volume accounts like Sean Miller generate negative net profits.
Next project

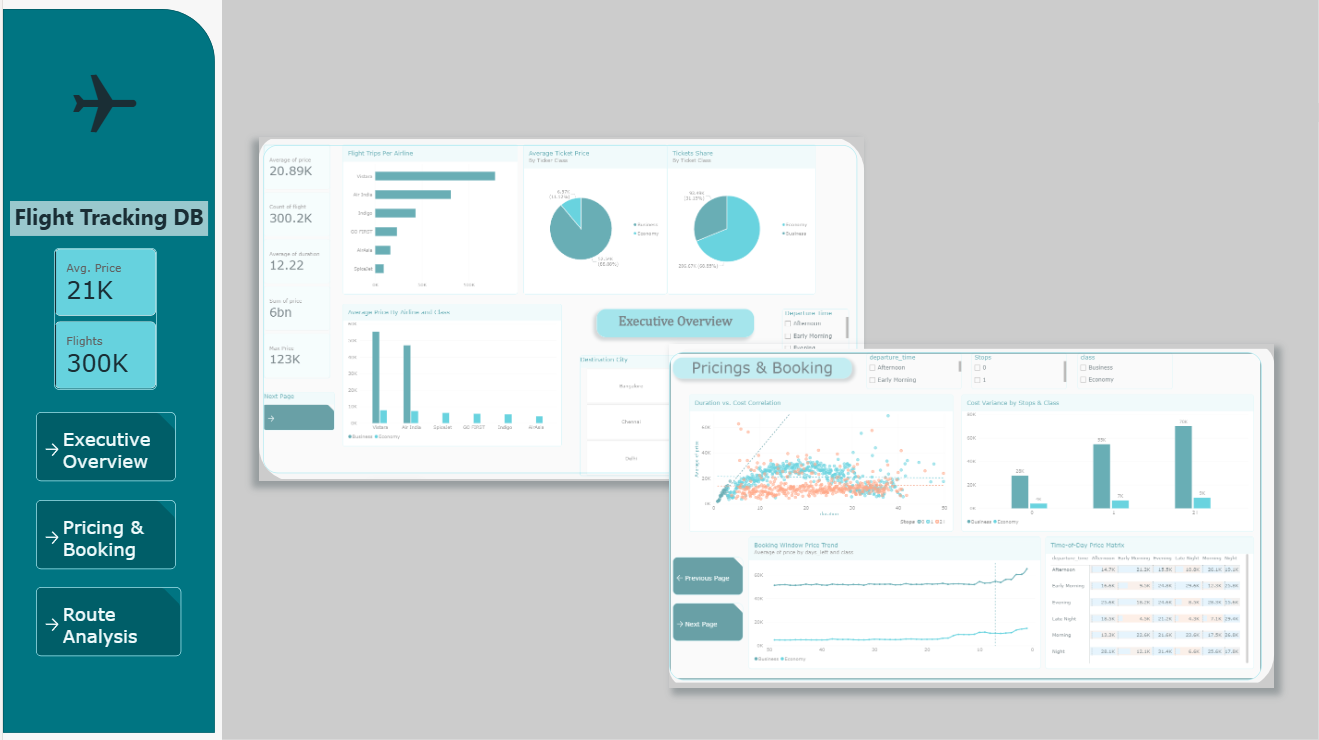
Flight Tracking DB

Pricing & route analytics